The Ultimate Guide to API Embedded Dashboards and Multi-Vendor Analytics
Why Choosing the Right Custom Analytics Embedding Platform Can Make or Break Your Product
A custom analytics embedding platform is the infrastructure layer that lets SaaS teams deliver branded, secure, interactive dashboards to their customers – without building everything from scratch.
If you’re evaluating your options, here’s a quick breakdown:
| Approach | Best For | Key Trade-off |
|---|---|---|
| Embed a general-purpose BI tool | Teams with existing BI investments | Slow iFrames, vendor branding, seat-based costs |
| Build analytics in-house | Teams needing total UI control | 6-18 months of engineering, $300k+ Year 1 cost |
| Headless / API-first embedding platform | SaaS teams shipping fast with full white-label | Requires upfront integration work |
| Multi-vendor unified embedding portal | Teams with dashboards across multiple BI tools | Less common; Embedportal is built for this |
Here’s a scenario that plays out constantly inside SaaS companies: a customer asks for a dashboard. Engineering says “sure, one sprint.” Six months later, the team is still wiring up permissions, multi-tenancy, and export formats – and the core product roadmap is stalled.
It’s not just about charts. It’s about everything that surrounds them.
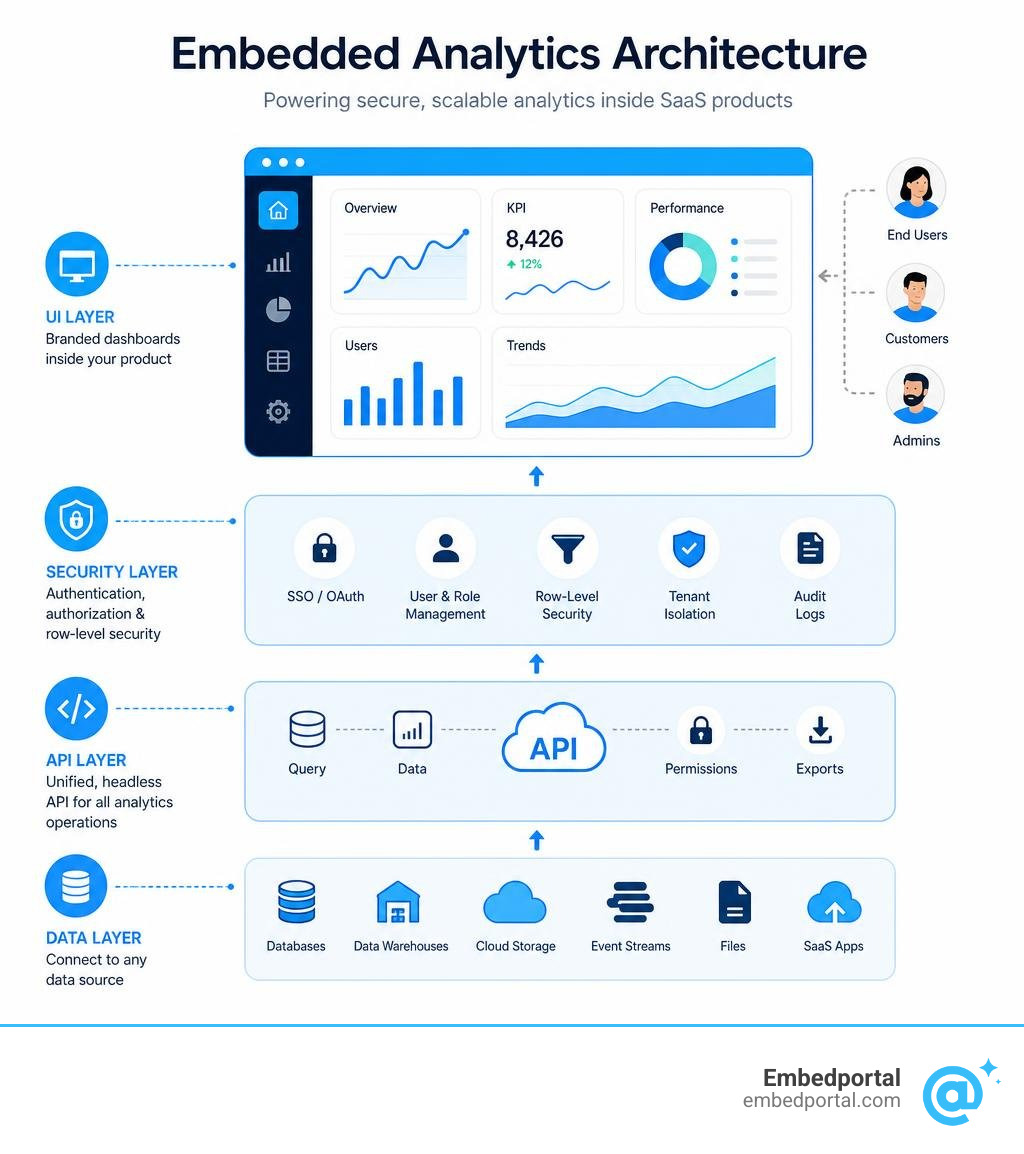
When you embed analytics into a customer-facing product, you’re signing up for row-level security, SSO integration, multi-tenant data isolation, white-label branding, and consistent performance across every user. That’s a lot of infrastructure – and most internal BI setups weren’t designed with any of it in mind for external users.
The problem gets even messier when your organization uses more than one BI tool. One platform for finance. Another for operations. Another for product usage. Now you need consistent branding, a unified auth layer, and coherent row-level security across all of them. Most guides skip this entirely.
This article compares the leading approaches and platforms for embedding analytics into your product, with a specific focus on the multi-vendor reality that most product and analytics leads actually face.
The Rise of the Custom Analytics Embedding Platform
In July 2026, delivering data to your customers is no longer an optional “nice-to-have” add-on. Modern SaaS buyers expect immediate, self-service access to the metrics their businesses generate.
When organizations try to meet this demand, they often run into a wall of complexity. This friction has fueled the rapid rise of the custom analytics embedding platform. Instead of forcing users to navigate clunky, disjointed interfaces, modern product teams use dedicated embedding middleware to build seamless, interactive data portals.
By integrating Embedded Analytics directly into your core application, you eliminate the friction that kills product adoption. The difference isn’t just convenience; it’s whether your customers actually engage with your data at all. When analytics requires leaving your application, logging into a separate portal, and hunting through pre-built reports, most users simply don’t bother.

This shift is backed by industry trends. Gartner estimates that by the year 2026, over 80% of business consumers will prefer intelligent assistants and embedded analytics over traditional dashboards for data-driven insights.
When you implement a unified Embedded BI strategy, you bridge the gap between analysis and action. Modern multi-vendor embedding platforms allow you to display dashboards from different underlying business intelligence tools in a single, cohesive, client-facing portal. This elevates user adoption and delivers real-time insights without requiring you to migrate all your legacy reports to a single vendor.
Why Standalone BI Fails Customer-Facing Applications
Traditional BI tools are built for internal business analysts, not external software customers. They assume a single-tenant environment where every viewer has an active corporate license.
When you try to use a standalone BI tool as an Embedded Analytics Platform for your SaaS, you run into three massive roadblocks:
- Single-Tenant Architecture Assumptions: Internal BI systems expect everyone to belong to the same organization. Forcing them to securely separate data for thousands of external customers requires complex, fragile workarounds.
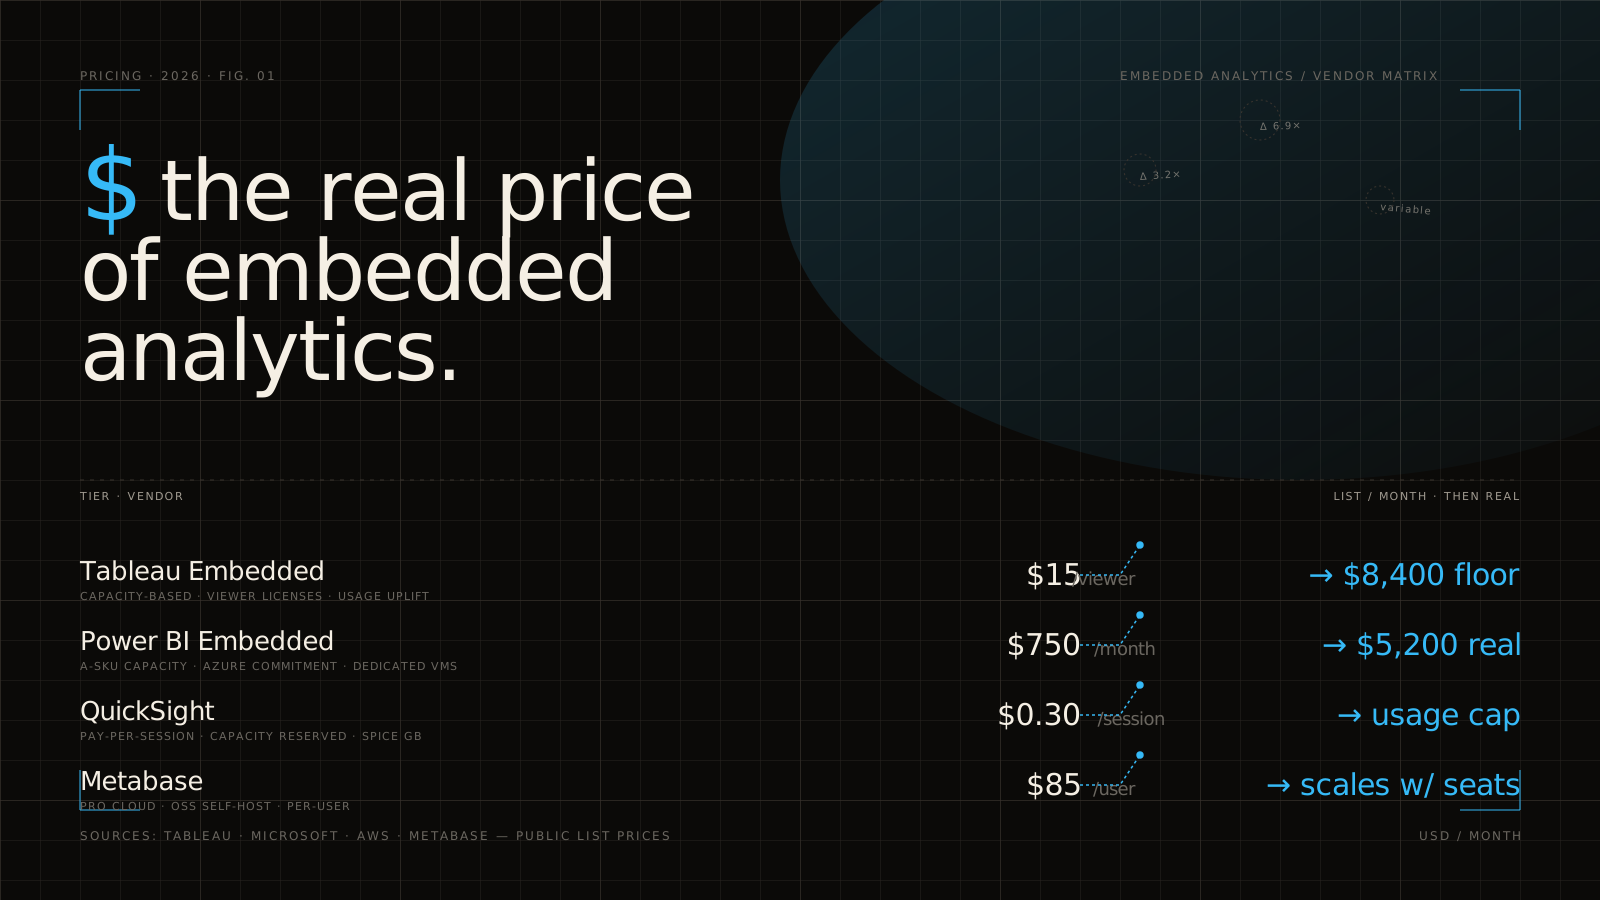
- Seat-Based Pricing Friction: Standard BI licensing model charges per user or per seat. If you have 10,000 customers who only check their dashboards once a month, paying $15 to $30 per seat makes customer-facing analytics financially impossible.
- Context-Switching and Brand Dilution: Forcing users to log into a separate portal with a different look and feel breaks the customer journey. If your application redirect looks like a completely different product, user trust drops.
The Shift Toward Seamless, User-Driven Interactive Analytics
Static, read-only charts are a relic of the past. Today’s users demand a high degree of real-time interactivity. They want to drill down into specific data points, filter views on the fly, and even write data back to their systems.
Modern solutions are incorporating advanced capabilities, such as natural language querying and generative BI embedded natively into your apps, which allow users to perform conversational queries directly inside their workflows.
By shifting to a modern embedding platform, you can offer customizable views and user-driven filtering that make your application feel like a premium, custom-built product.
Architectural Trade-offs: iFrames, SDKs, and Unified APIs
When planning your integration, the technical approach you choose directly impacts loading speed, development complexity, and user experience.
As we explore in The iFrame is the Easy Part: What Embedded Analytics Needs, getting a chart onto a web page is simple. The real challenge is managing the underlying performance, security, and rendering logic.
The Limitations of Traditional iFrame Embedding
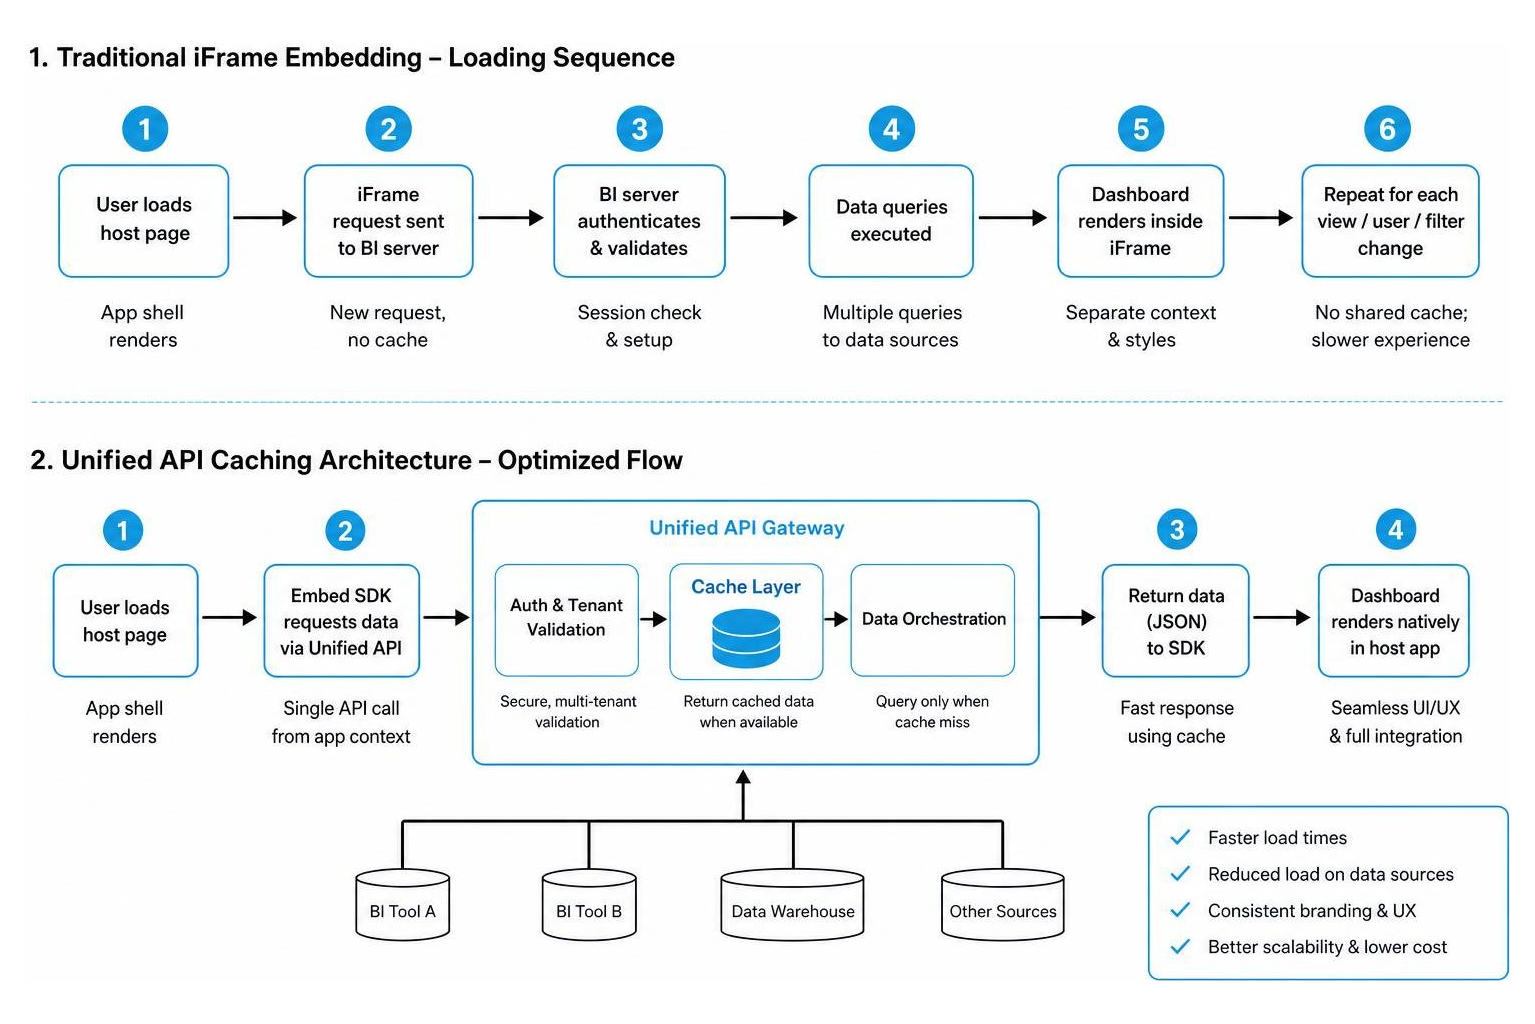
For a long time, iFrames were the default embedding method. They are fast to set up, but they come with significant UX and technical penalties:
- Poor Mobile Responsiveness: iFrames act as rigid windows into another webpage. They do not scale or reflow naturally within your application’s responsive layout.
- Slow Loading Speeds: Every iFrame embed requires loading an entire external application instance, complete with its own scripts, stylesheets, and assets. This often pushes page load times past the critical 3-second threshold.
- Styling and Customization Gaps: You cannot easily style the content inside an standard iFrame using your parent application’s CSS. This leaves you with obvious visual inconsistencies.
- Complex Interactivity: While tools like the vendor JavaScript API allow some communication between the host app and the embed, orchestrating complex state synchronization across multiple iFrames from different vendors is incredibly difficult.
API-First Embedding and Web Components for Native Performance
To bypass these limitations, modern teams are moving toward API-first embedding and native Web Components.
By leveraging Embedded Data Analytics through a unified API layer, your application communicates directly with the underlying BI engines server-side. This allows you to:
- Implement Multi-Tier Caching: Cache query results closer to the user to achieve sub-second dashboard loading times.
- Deliver Native Styling: Render charts using your own front-end components or lightweight visualization libraries that inherit your design system’s CSS variables.
- Build Custom Widgets: Create interactive elements that trigger actions inside your SaaS app when a user clicks a chart element.
Security and Governance in Multi-Tenant Environments
In a multi-tenant SaaS application, security is non-negotiable. A single data leak – where Tenant A accidentally sees Tenant B’s metrics – can destroy customer trust and expose your business to severe compliance liabilities.
When implementing Multi-Tenant Analytics, you must ensure that your data isolation is enforced at the database or query level, rather than simply hiding visual components in the browser.
Implementing Row-Level Security (RLS) Across Multiple Vendors
Row-Level Security (RLS) ensures that users only see the specific rows of data they are authorized to access.
If you want to master this, The Ultimate Guide to Row Level Security (RLS) details the foundational principles. However, executing this in a multi-vendor environment introduces unique challenges.
When you embed dashboards from different providers simultaneously, you must map user identities to different security models. In our guide on How to Handle Secure BI Embedding Across Multiple Vendors, we detail how a unified embedding platform can act as a secure translation layer.
By dynamically passing token identities and enforcing RLS rules at query time, you ensure consistent, bulletproof data isolation across every connected BI environment from a single authentication event.
Centralized Authentication and SSO Integration
To make the user experience seamless, your embedded dashboards must integrate with your application’s existing Single Sign-On (SSO) flow.
According to The Developer’s Guide to SSO Analytics Embedding, the best practice is to generate secure, short-lived JSON Web Tokens (JWTs) on your backend. These tokens securely sign the embed request, passing the user’s role, tenant ID, and permissions without exposing raw database credentials or requiring a separate login screen.
Total Cost of Ownership: Build vs. Buy Economics
Many product teams underestimate the long-term costs of building customer-facing analytics from scratch. They look at the initial cost of a charting library and assume it’s a simple, two-week project.
To help put this in perspective, let’s look at the real economic trade-offs over a 24-month horizon:
| Cost Factor | In-House Custom Build | Dedicated Embedding Platform |
|---|---|---|
| Initial Dev Time | 6 to 18 months | Under 1 hour to 2 weeks |
| Year 1 Engineering Salary | ~$180,000 (3 developers part-time) | Included in platform subscription |
| Security & Compliance (RLS/SSO) | ~$45,000 (custom implementation) | Built-in, out of the box |
| QA & Multi-Tenant Testing | ~$25,000 | Automated / Platform managed |
| Ongoing Maintenance / Year | ~$150,000 (updates, bug fixes, API changes) | Minimal (handled by platform provider) |
| Total Year 1 Cost | $300,000+ | $12,000 to $50,000 |
When evaluating Embedded Analytics Pricing, you have to look beyond the software license. For a deeper dive into the actual line items, see How Embedded Analytics Pricing Actually Works in 2026.
Evaluating a Custom Analytics Embedding Platform for SaaS
For SaaS companies based in California and serving global markets, scaling your reporting features efficiently is a direct driver of profitability.
Using an Embedded Analytics for SaaS platform allows you to quickly turn raw data into a monetized product feature. Instead of wasting expensive engineering sprints on building custom report builders, you can Stop Coding Reports Manually and Use an Embed Reporting Platform.
This frees your developers to focus on core product features while allowing you to package advanced analytics, self-service builders, and AI-driven insights into higher-paying premium tiers.
Hidden Infrastructure and Maintenance Costs
The initial build is only 10% of the battle. The remaining 90% goes toward maintaining the infrastructure.
In our resource on How to Handle Enterprise Dashboard Embedding Without Breaking Your Budget, we highlight several hidden costs that teams routinely miss:
- Data Warehouse Load: Poorly optimized, un-cached queries from thousands of external customers can cause your cloud data warehouse bills to skyrocket.
- API Token and Tool Call Costs: If you expose natural language AI query tools directly to end-users without query-level guardrails, your LLM API token consumption can scale rapidly and unpredictably.
- Maintenance of BI API Changes: General-purpose BI vendors frequently update their embedding SDKs and APIs. If you write custom wrappers, you must continuously update your codebase to prevent dashboards from breaking.
When evaluating your options, it is crucial to choose a platform that scales with your user base without unpredictable cost spikes. Additionally, if you are exploring AI integration, modern embedding platforms are increasingly supporting secure ways to connect LLMs to your databases, allowing users to ask questions of their data in plain English.
Achieving Seamless White-Labeling and Brand Consistency
Your customers should never feel like they are looking at a third-party tool. The moment a user spots an external logo, a mismatched font, or an off-brand color scheme, the illusion of a unified application is shattered.
Achieving true White Label Analytics is critical for maintaining brand authority and trust.
How a Custom Analytics Embedding Platform Preserves Brand Identity
A dedicated embedding platform gives you total control over the visual presentation layer. In our guide, No More Third Party Logos: A Guide to Branded Reporting Embedding, we discuss how to eliminate external vendor mentions entirely.
By using a modern Analytics Embedding Platform, you can apply custom domains, upload your own logos, and use declarative styling properties to make the analytics feel like a native extension of your product.
Multi-Vendor White-Labeling Challenges
If your company serves diverse enterprise clients, you might need to display reports, operational dashboards, and product analytics views from multiple underlying BI environments.
This is where standard white-labeling tools fall short. In The Challenges of Multi-Vendor Reporting and How to Solve Them, we examine how hard it is to maintain consistent CSS variables, fonts, and chart themes across multiple underlying BI systems.
A unified embedding layer solves this by acting as a styling translation engine, ensuring that regardless of where the data is hosted, it renders in a single, beautiful, and on-brand interface.
Frequently Asked Questions about Custom Analytics Embedding
What is the difference between SDK-based and iframe-based embedding?
IFrame embedding loads a pre-built dashboard as an isolated external window. It is incredibly fast to set up but offers limited styling control, slower performance, and poor mobile responsiveness.
SDK-based or Web Component embedding integrates directly into your application’s front-end code. This approach allows for native performance, sub-second loading speeds via caching, and complete control over CSS styling and interactive JavaScript events.
How do you handle multi-tenant security when embedding dashboards from different BI vendors?
We handle this by routing all embed requests through a secure gateway. This gateway takes your user’s SSO or JWT session data, identifies their tenant and permission level, and dynamically applies Row-Level Security (RLS) tokens specific to each target BI vendor.
This ensures that whether the chart is powered by one BI environment or another, the query is filtered at the data source, and tenants can never access each other’s records.
Can embedded analytics be monetized as a premium SaaS feature?
Absolutely. In fact, 57% of product teams report that customer-facing analytics has a direct, positive impact on their bottom-line revenue.
You can offer basic static charts in your entry-level tier, while unlocking interactive filtering, CSV/PDF exports, self-service custom report builders, and conversational AI querying in your higher-tier, premium packages.
Conclusion
Building customer-facing reporting doesn’t have to hijack your engineering roadmap for the next twelve months.
With Embedportal, you can bypass the complexity of custom widget development, manual permission mapping, and fragile iframe styling. We provide a secure, white-label embedding platform that lets your team deliver unified multi-vendor analytics across your existing BI stack under your own brand, with robust row-level security and single sign-on.
Ready to see how easy it is? Learn how to go from Zero to Embedded Analytics in Under an Hour or dive deep into our developer guides for vendor-specific embedding. Let us handle the infrastructure so you can focus on building your core product.