
Getting a Power BI report onto a page is the easy part. Making it feel like it belongs in your product is where the Power BI JavaScript API starts to matter, because that is what gives you control over loading, filtering, navigation, and events instead of dropping in a glorified iframe.
What the Power BI JavaScript API actually helps you do
The Power BI JavaScript API is the client-side layer that lets your app talk to an embedded Power BI report after it appears in the browser. Instead of just showing a report, you can decide which page opens first, hide panes, apply filters from your app, react to button clicks, and inspect the report structure once it has loaded.
Here’s the thing: basic embedding is not the hard part. The trick is making analytics respond to what your user is already doing in your app. If somebody is looking at account 4827 in your dashboard at 9:14 on a Tuesday morning, the embedded report should open with that account context already applied, not ask for one more click.
Prerequisites: What you need before you embed anything
Before touching code, get the minimum pieces in place. That saves you from the usual loop of debugging frontend code when the real problem is a missing token or the wrong workspace access.
A Power BI report and workspace
You need a report that already exists in Power BI Service and lives in a workspace you can access. Your site does not create the report during embedding, it only loads one that has already been published.
If the report is still sitting in Power BI Desktop, stop there and publish it first. Embedding starts after the report is in the service.
An embed scenario picked ahead of time
You need to choose between User Owns Data and App Owns Data before building much of anything.
User Owns Data means your users sign in and view content with their own Power BI permissions. App Owns Data means your application handles the embedding and your end users do not need their own Power BI accounts. For customer-facing products, App Owns Data is usually the better fit, and in that model customers do not need individual Power BI licenses.
That choice changes authentication, licensing, and who can see what, so it is not a small detail.
Your embed details and access token
Your page needs a few core values: the embed URL, the report ID, and a valid token. Depending on your setup, that token is an access token or an embed token.
The browser uses those values to render the report, but your backend usually supplies the token. Keep that part server-side. Handing out token generation logic in frontend code is like taping your office key under the doormat.
A web page or app where the report will live
You also need somewhere to render the report. That can be a plain HTML page, a React component, or another JavaScript app shell. Any modern setup works as long as you can place a container element on the page and run JavaScript against it.
Step 1: Add the Power BI JavaScript client library
- Add the library to your project before trying to embed anything.
- Pick the setup that matches your app.
- Confirm that your page can access the Power BI client objects.
Install with npm or include the script directly
If your app uses a bundler, install powerbi-client with npm and import it in your code. If you just want a quick test page, include the script directly in HTML.
Both routes lead to the same embedding API. One is cleaner for real apps, the other is faster for a proof of concept.
Create a container for the embedded report
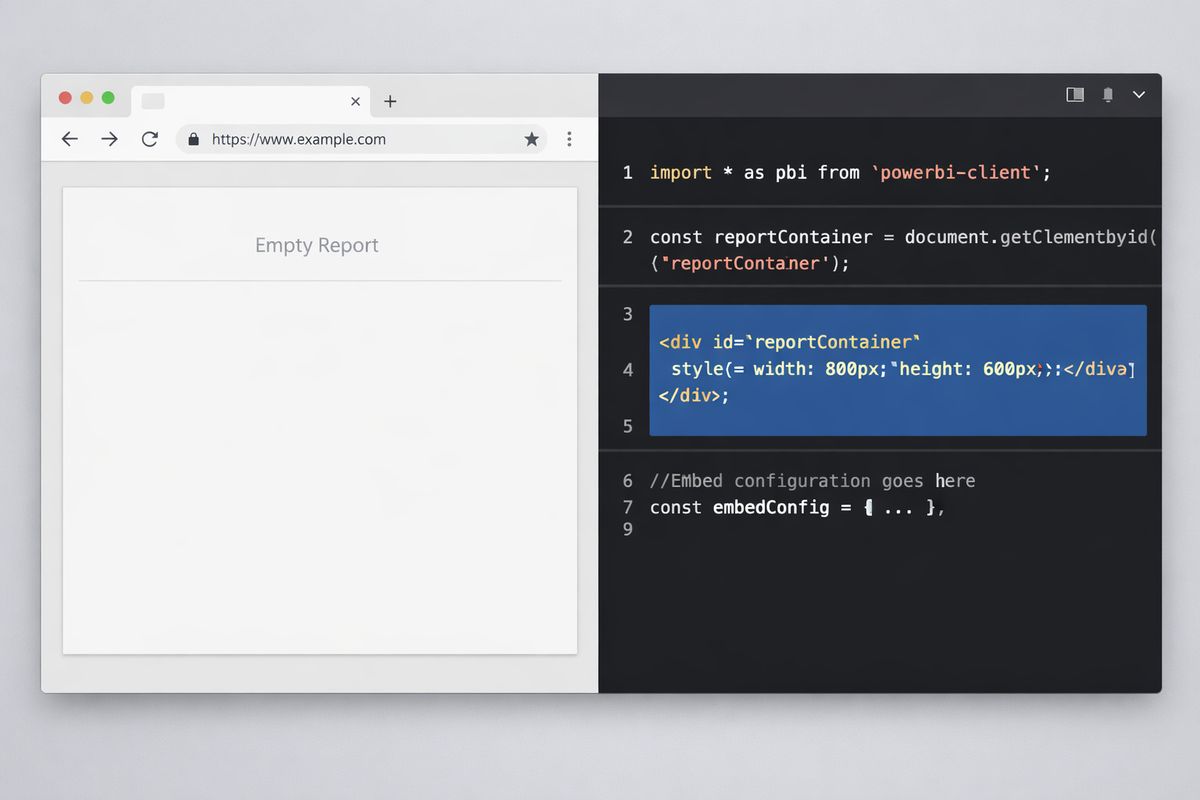
Add a div where the report should appear, and give it an actual height in CSS. A report cannot render into a zero-height box.
That sounds obvious, but a tiny or missing container is one of those annoying mistakes that can burn twenty minutes for no good reason.
<div id="reportContainer" style="height: 700px;"></div>
Step 2: Build the basic embed configuration
- Create a JavaScript object for the embed config.
- Fill in the required values from your backend or setup.
- Add only a few display settings for the first pass.
Add the required properties
Your config object usually includes type, id, embedUrl, accessToken, tokenType, and permissions. In plain English, those tell Power BI what you are embedding, which report to load, where it lives, what token authorizes access, what kind of token it is, and what the user is allowed to do.
A basic example looks like this:
const embedConfig = {
  type: 'report',
  id: reportId,
  embedUrl: embedUrl,
  accessToken: accessToken,
  tokenType: window['powerbi-client'].models.TokenType.Embed,
  permissions: window['powerbi-client'].models.Permissions.All
};
Choose a few starter settings
Start simple. You can hide the filter pane, adjust navigation, or set layout options later, but the goal right now is a clean working embed.
embedConfig.settings = {
  panes: {
    filters: { visible: false }
  }
};
Step 3: Embed the report into your page
- Get a reference to your container element.
- Call the embed method with the container and config.
- Save the returned object.
Call the embed method
This is the point where the report stops being configuration data and becomes something visible on screen. Under the hood, Power BI uses the browser to create and initialize the embedded content, then renders it into your page using the values you passed in, as described in the embedding flow.
const powerbi = new window['powerbi-client'].service.Service(
  window['powerbi-client'].factories.hpmFactory,
  window['powerbi-client'].factories.wpmpFactory,
  window['powerbi-client'].factories.routerFactory
);

const container = document.getElementById('reportContainer');
const report = powerbi.embed(container, embedConfig);
Store the returned report object
Keep the report object. That is your handle for everything that comes next, including pages, visuals, filters, and events.
Without it, your embed is just sitting there. With it, your app can actually control what happens.
Step 4: Wait for the report to load before doing anything fancy
- Attach a loaded event handler.
- Put follow-up API calls inside that handler.
- Add an error handler right away.
Listen for the loaded event
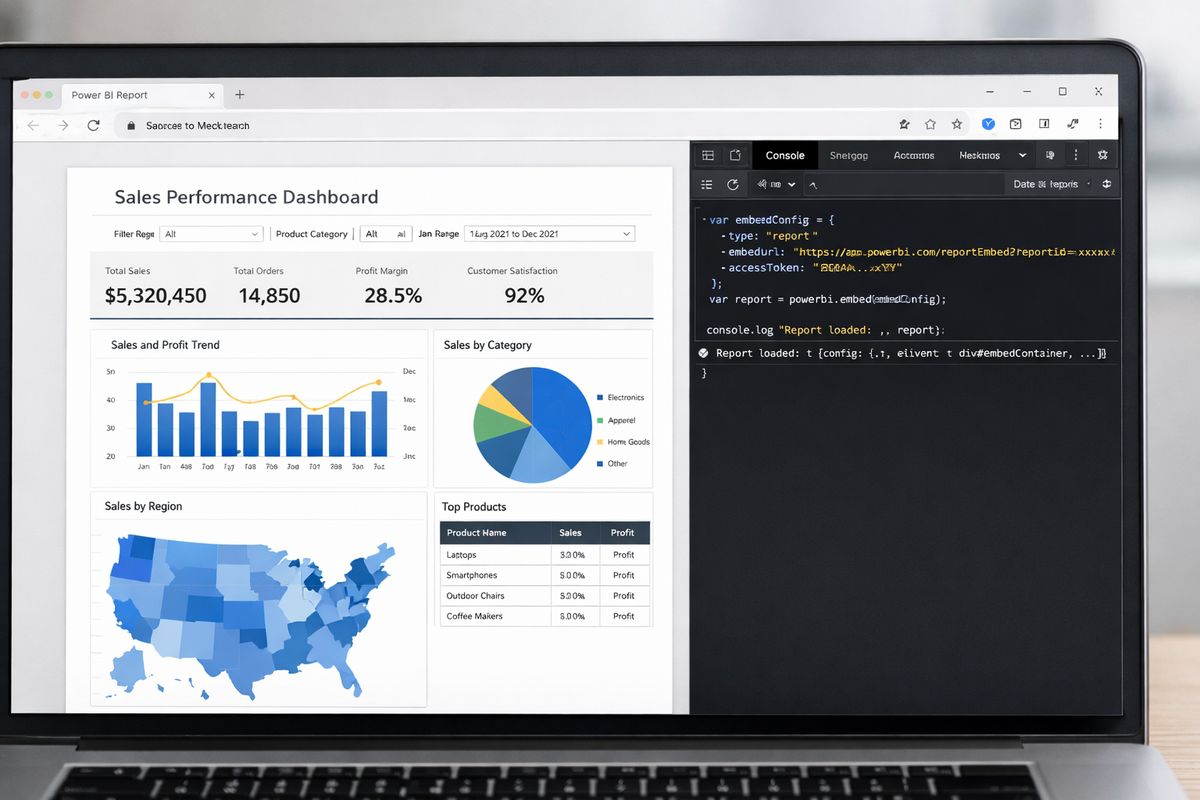
This is the beginner mistake that causes a lot of false debugging: calling methods too early. Microsoft is very clear that the report must be loaded before calls like getPages() or getVisuals() will work.
report.on('loaded', async function () {
  console.log('Report loaded');
});
Use that event as your safe checkpoint. If you want reliability, start there.
Add basic error handling
Listen for error events and log the details. Expired tokens, wrong report IDs, and permission mismatches show up here fast.
report.on('error', function (event) {
  console.error(event.detail);
});
Clear error output is boring right up until it saves your afternoon.
Step 5: Read pages and visuals from the embedded report
- Wait for the report to load.
- Call
getPages()on the report. - Pick a page and call
getVisuals().
Get the report pages
After the report loads, you can inspect its pages. The report.getPages() method returns pages in the same order as the report itself, which is handy if you want your own custom tabs or want to check which page is active.
report.on('loaded', async function () {
  const pages = await report.getPages();
  console.log(pages.map(p => p.displayName));
});
Get visuals from a page
A visual is any report element like a chart, table, card, or slicer. Once you have a page object, you can inspect its visuals and make smarter UI decisions around it. Microsoft documents this flow through page visuals.
report.on('loaded', async function () {
  const pages = await report.getPages();
  const firstPage = pages[0];
  const visuals = await firstPage.getVisuals();
  console.log(visuals);
});
Step 6: Add one useful interaction with filters or page navigation
- Pick one app-driven action.
- Tie it to something your user is already doing.
- Keep the first interaction small and obvious.
Apply a filter based on app context
A good first win is passing app context into the report. If your app already knows the customer ID, region, or account name, use that value to filter the report so the content matches the current screen.
That is where embedded analytics starts feeling native. Not separate. Not bolted on.
Switch pages programmatically
You can also move users to a specific page from your own buttons or navigation. Think of it like sending somebody straight to the right room instead of making somebody wander the hallway.
After getting the pages, find the one you want and call setActive() on it.
const pages = await report.getPages();
const targetPage = pages.find(p => p.displayName === 'Sales');
if (targetPage) {
  await targetPage.setActive();
}
Step 7: Listen for events from the embedded report
- Subscribe to one or two useful events.
- Run app logic when those events fire.
- Remove listeners when the page or component is done.
Attach event handlers with report.on(...)
The JavaScript API is not just for rendering. It also lets your app respond to user actions through embedded events, including buttonClicked, commandTriggered, and dataHyperlinkClicked.
report.on('buttonClicked', function (event) {
  console.log('Button clicked', event.detail);
});
That can trigger navigation, logging, or app-specific actions outside the report.
Remove handlers when you no longer need them
In single-page apps, event handlers can pile up if a component mounts more than once. Use report.off(...) to clean up old listeners before reattaching them.
That helps prevent duplicate logs, duplicate actions, and that weird feeling that your app is haunted.
Step 8: Sanity-check licensing and embedding model before launch
- Match the technical setup to your audience.
- Review licensing before rollout.
- Recheck pricing with current Microsoft pages.
Match your setup to internal users or external customers
User Owns Data fits internal teams that already work in the Microsoft ecosystem. App Owns Data is usually the better route for external customer portals, especially when you do not want every customer managing a Power BI license.
Verify current pricing before rollout
Do not trust old pricing screenshots. Microsoft raised Pro and PPU pricing in 2025, and older guides can be stale. Check current numbers before budgeting, especially if you are comparing per-user licenses with embedded capacity. For example, Power BI Pro is $14, PPU is $24, Fabric F2 starts at $262 per month, and Embedded A1 starts around $735 per month.
Troubleshooting: Common issues when the embed does not behave
The report loads blank or never appears
Start with the simple stuff: confirm the container has height, the embed URL is correct, the token is still valid, and the report is actually shared or accessible under your chosen model. A blank page often comes from one of those, not from the API itself.
API calls fail after embedding
If getPages() or getVisuals() throws errors, check when you are calling them. The fix is usually simple: wait for loaded, then run follow-up logic.
Events fire more than once
This usually means your handlers are getting attached repeatedly. Remove old listeners before adding new ones, especially in React, Vue, or any app with rerendering.
What you should have working now
At this point, you should have a report embedded inside your app, loading safely after the right token and config are passed in. You should also have a saved report object, a reliable loaded checkpoint, and at least one useful interaction like page switching, filtering, or event handling.
That is the point where the embed stops feeling like an iframe and starts acting like part of your product.
Next steps: Try one small upgrade right away
Try one upgrade on a test page: add a filter from your app state, build custom page tabs from getPages(), or listen for one event and log it. Pick just one.
That small step is where the Power BI JavaScript API starts paying off, because once your report reacts to your app instead of merely sitting inside it, the whole integration gets a lot more useful.