Zero to Embedded Analytics in Under an Hour
Why You Need to Embed Analytics Under an Hour in 2026
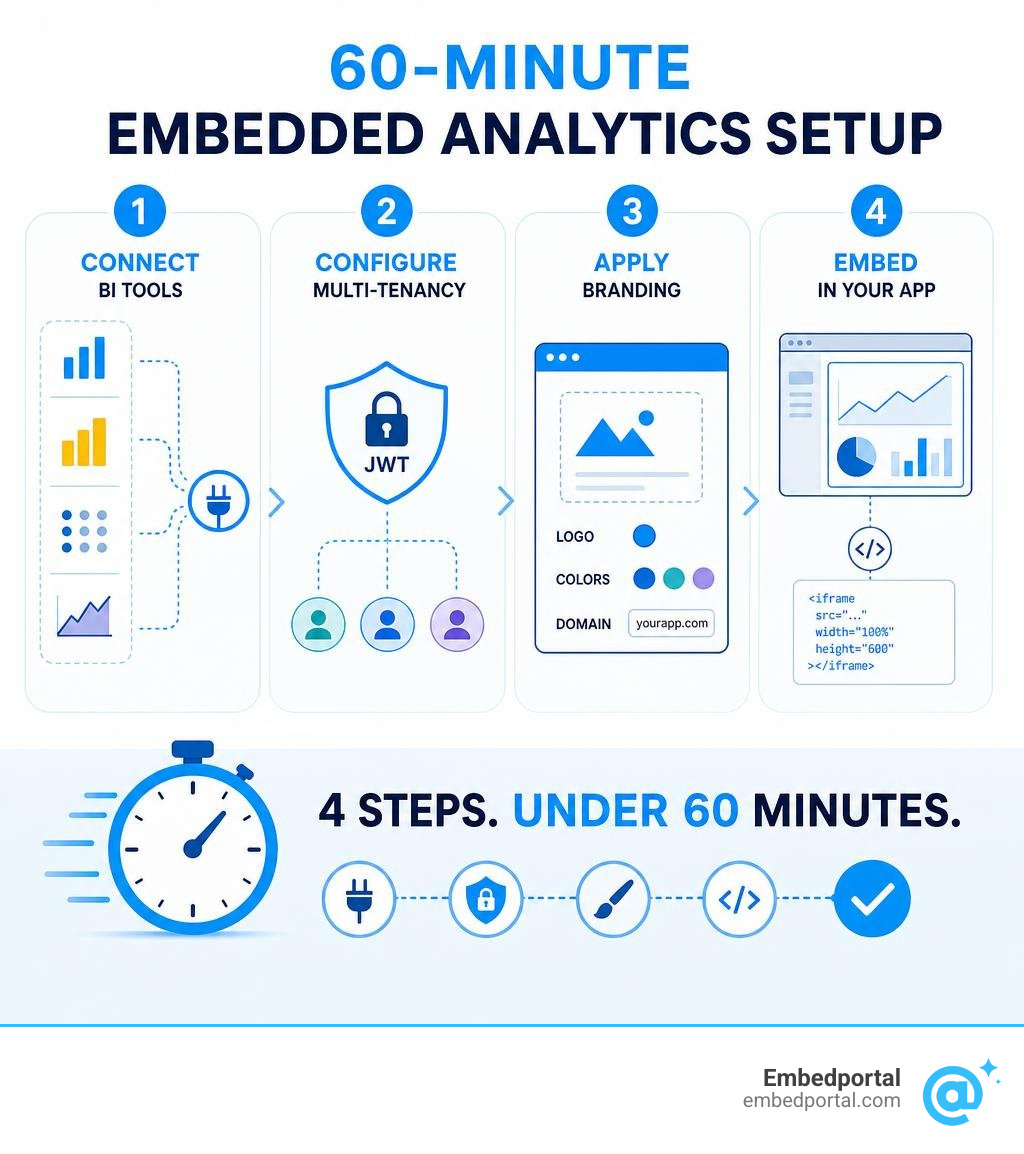
If you’re looking to embed analytics under an hour, here’s the fastest path:
- Connect your existing BI dashboards (Tableau, Power BI, Metabase, QuickSight) to a vendor-managed embedding platform
- Configure multi-tenant row-level security using JWT tokens
- Apply white-label branding (logo, colors, custom domain)
- Embed via a single iframe or web component into your product UI
Most teams using a managed platform like Embedportal complete all four steps in a single session — no custom backend, no months-long sprint.
Somewhere in the growth of almost every B2B SaaS product, customers start asking for the same thing: a way to see and report on their own data without leaving your app.
That request used to land in a backlog and sit there for months. Today, it’s a dealbreaker.
Customers now treat dynamic, intuitive analytics inside an application as a make-or-break capability when deciding what to buy. If your product doesn’t show customers their own data in a meaningful way, a competitor’s product will.
The problem isn’t that embedding analytics is technically impossible. It’s that the traditional path — build it yourself, wire up security, maintain it forever — is brutally slow and expensive. Developers report spending 30+ hours per week just handling customer-specific content requests, performance problems, and data inconsistencies when managing homegrown analytics infrastructure.
There’s a faster way. And it fits inside an hour.
Handy embed analytics under hour terms:
The Reality of Modern SaaS: Why You Need to Embed Analytics Under Hour
In the highly competitive SaaS landscape of 2026, data transparency has evolved from a premium upsell to a standard expectation. When users log into a software platform, they do not just want to perform actions; they want to see the immediate, measurable impact of those actions.
Providing this visibility is directly tied to customer retention. For example, industry success stories like JobNimbus have achieved a 70% enterprise user adoption rate and significantly reduced customer churn by delivering native, interactive embedded analytics experiences. When customers can visualize their return on investment directly inside your product, the software becomes sticky. It transforms from a simple utility into an indispensable source of business intelligence.
Conversely, failing to provide these insights creates a severe feature gap. When customers cannot find the reports they need, they resort to exporting raw CSV data and rebuilding their analysis manually in external spreadsheets. Once a user begins pulling data out of your application to analyze it elsewhere, your product loses its position as the single source of truth, making it highly vulnerable to churn.
To prevent this, SaaS companies must integrate data presentation directly into their offering. Implementing Embedded Analytics for SaaS bridges this gap, turning complex raw databases into beautiful, customer-facing interfaces.
The Shift from Standalone BI to Native Customer Experiences
Historically, companies attempted to solve the reporting problem by pointing customers to external Business Intelligence (BI) tools. However, standalone BI applications are fundamentally built for internal analysts, not external, non-technical business users. Forcing a customer to leave your application, log into a separate portal, and navigate a complex, unfamiliar interface destroys the user experience.
True SaaS BI Embedding is about bringing the analytics directly into the user’s natural workflow. Instead of jumping between tabs, a retail merchant can view real-time sales performance right next to their inventory manager, or a healthcare provider can view patient outcome trends directly inside an electronic health record system.
When analytics are native, they feel like an organic extension of your application. This seamless integration dramatically increases user engagement—in fact, studies show up to an 84% adoption rate of analytics features when they are embedded directly inside a host product compared to when they live in disconnected external tools.
Why Traditional BI Fails to Embed Analytics Under Hour
When product teams decide to bring analytics inside their application, their first instinct is often to take their existing internal BI dashboards and embed them using standard, basic iframes. They quickly discover that the raw iframe is only a tiny fraction of the puzzle.
Traditional BI platforms were never designed with tenant isolation, custom SaaS branding, or web-scale authentication in mind. If you try to embed a standard dashboard directly, you will immediately run into significant technical roadblocks:
- Authentication Hurdles: Your application has its own user directory, but the BI tool expects its own set of credentials. Forcing users to log in twice is unacceptable, yet setting up Single Sign-On (SSO) across different legacy systems can take weeks of custom engineering.
- The Multi-Tenancy Nightmare: In a SaaS application, Customer A must never see Customer B’s data. Standard BI tools are designed to query global datasets. Forcing them to filter dynamically based on the logged-in SaaS user requires complex backend routing, custom API wrappers, or duplicating dashboards for every single customer.
- Styling Disconnects: A standard BI embed comes with its own headers, toolbars, and color schemes, making it look like a clunky third-party widget slapped onto your polished UI.
As we often say in the engineering community, The iFrame is the Easy Part: What Embedded Analytics Needs goes far deeper than simple HTML tags. It requires a robust middleware layer that handles security, permissions, performance, and styling in the background.
Build vs. Buy: The Hidden Costs of DIY Analytics
When faced with the need for customer-facing dashboards, many engineering teams think, “Why should we pay for an embedding platform? We have React, we have chart libraries, and we have SQL. We can just build this ourselves.”
This is the classic build-vs-buy trap. While throwing together a few basic charts with a free library might take a developer a couple of days, building a production-grade, multi-tenant analytics suite from scratch is an entirely different beast.
To help illustrate the differences, let’s look at how a DIY build compares to utilizing a managed Embedded Analytics Platform:
| Feature / Requirement | DIY In-House Build | Managed Embedding Platform (Embedportal) |
|---|---|---|
| Initial Time-to-Market | 3 to 6 months of dedicated engineering | Under 1 hour |
| Multi-Tenant Security | Custom-coded row-level database filtering | Native, JWT-signed row-level security |
| Styling & Customization | Hardcoded CSS, highly brittle UI updates | Fully white-labeled, dynamic CSS variables |
| Maintenance & Support | 30+ hours/week of ongoing developer effort | Fully managed infrastructure and automatic updates |
| Self-Service Capabilities | Extremely difficult to build; requires custom drag-and-drop engines | Built-in, secure ad-hoc exploration for end-users |
| Total Cost of Ownership (24 Months) | $18,000 – $48,000+ in hidden engineering time annually | Predictable, scalable software subscription |
Building analytics in-house forces your engineering team to step away from your core product roadmap to build what is essentially a secondary, mini-BI application. This hidden distraction is beautifully analyzed in the industry podcast episode #291: The Data Work that Lives in the Shadows, which explores how invisible data infrastructure tasks quietly consume massive amounts of engineering bandwidth.
The Maintenance Trap and Developer Burnout
The real cost of building your own analytics is not the initial development phase; it is the endless cycle of maintenance. Once dashboards are live, the feature requests start pouring in:
- “Can we export this specific chart to a PDF?”
- “Can we schedule a weekly CSV export to our email?”
- “Can we change the chart type from a bar chart to a line chart?”
- “Why is this specific query loading so slowly for our largest customer?”
Because your custom build lacks a self-service interface, every single one of these requests must be handled manually by a software engineer. Developers report spending 30+ hours per week on customer-specific content, debugging database performance bottlenecks, and resolving data discrepancies. This constant operational drag causes severe developer burnout and slows down your core product development.
Security Risks of Scaling DIY Multi-Tenancy
Security is where DIY analytics transitions from an expensive distraction to a massive liability. When you only have 5 or 10 customers, managing data access using basic database queries might feel manageable. However, once you scale to 50+ customers, DIY multi-tenancy becomes incredibly risky.

If your engineering team relies on frontend filters or simple API parameters to restrict data, a single malicious user—or even a simple frontend bug—can expose sensitive customer data to the wrong tenant. In B2B SaaS, a data leak of this nature is catastrophic, often resulting in immediate contract termination, legal penalties, and irreparable brand damage.
To scale safely, you must implement robust Multi-Tenant Analytics that enforce data isolation at the database query level, completely isolated from any frontend manipulation.
Step-by-Step Guide: How to Deploy Fast Embedded Analytics
Now that we understand the immense risks of building from scratch, let’s walk through how we can leverage Embedportal to securely and beautifully embed analytics under hour.
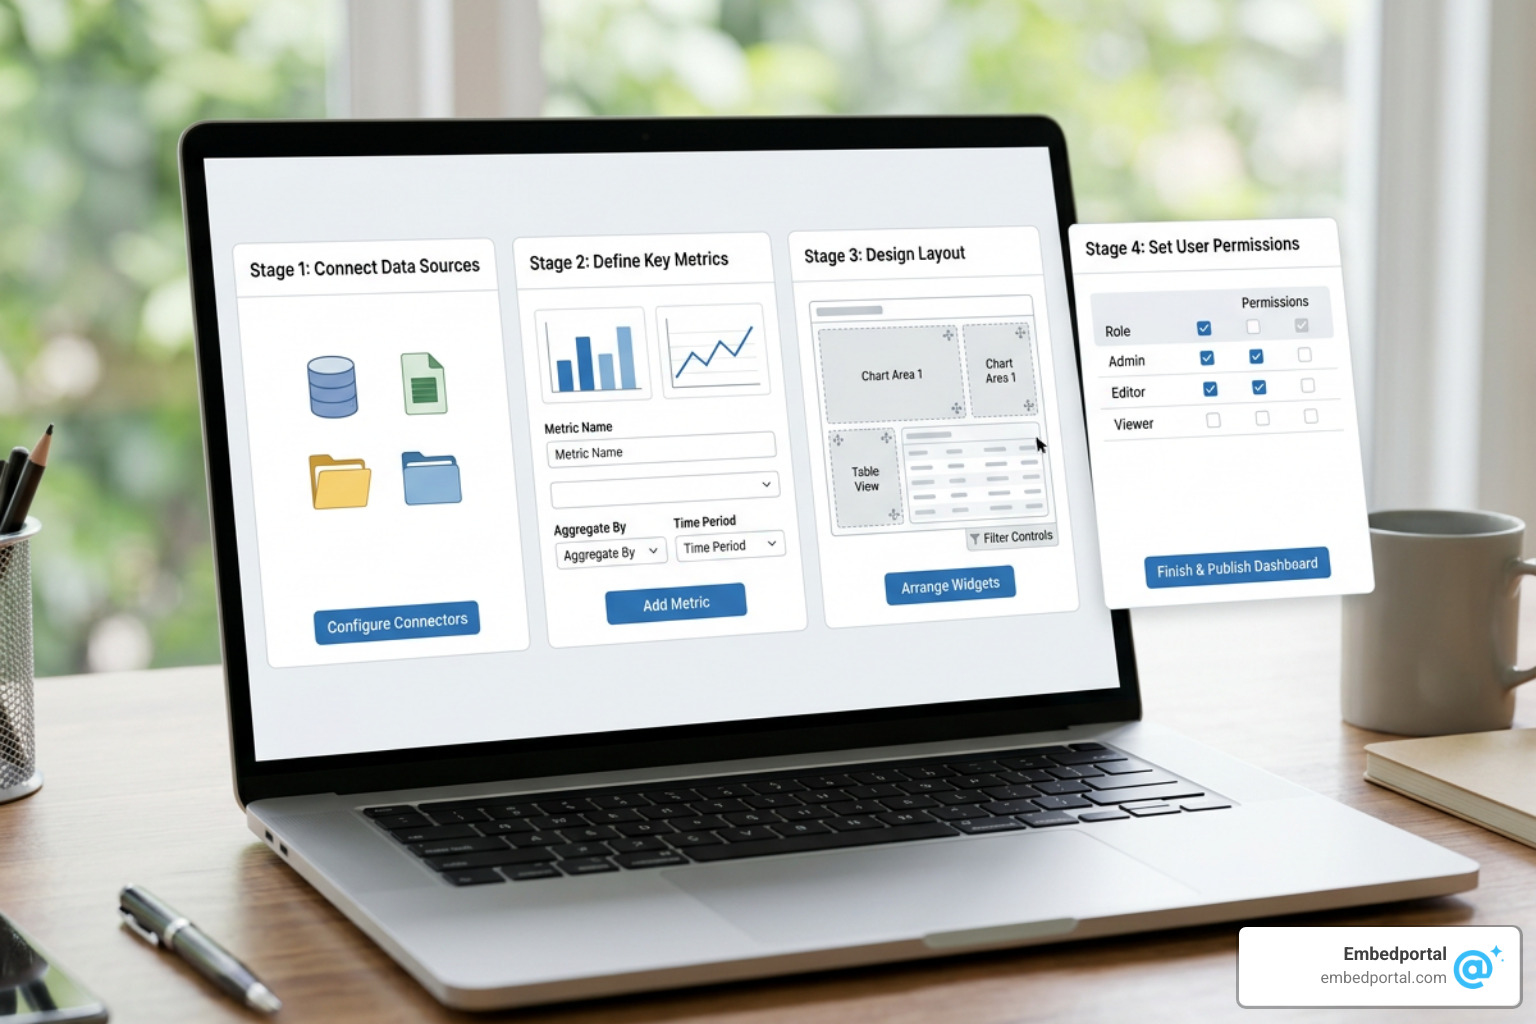
By utilizing a developer-friendly, managed middleware layer, we can bypass months of database modeling, backend security coding, and UI styling. Here is the complete step-by-step workflow to get your customer-facing dashboards live in production today.
How to Securely Embed Analytics Under Hour with Modern SDKs
To achieve a fast and secure deployment, we use a token-based authentication mechanism. Instead of exposing your master BI credentials or database connection strings to the client’s browser, your backend application will generate a short-lived JSON Web Token (JWT).
This JWT is signed using a secure secret key provided by Embedportal. When the user’s browser requests the embedded dashboard, our platform verifies the signature of the JWT, extracts the tenant parameters, and dynamically renders the secure data.
Let’s look at a simple architectural flow of how this works:
- User requests dashboard: The customer navigates to the reporting page in your SaaS application.
- Backend generates token: Your server-side application mints a JWT containing the user’s details and their tenant identifier (e.g.,
tenant_id: "client_123"). - Frontend renders embed: Your frontend requests the dashboard from Embedportal, passing the secure JWT.
- Data is filtered and displayed: Embedportal validates the token, queries your BI tool or warehouse using secure row-level filters, and displays the personalized dashboard inside your UI.
This entire flow can be set up in minutes using our lightweight SDKs or standard iframes. For hands-on practice setting up similar secure token flows, you can review the technical setup steps in the Embedded Analytics Workshop.
Step 1: Connect Your Multi-Vendor BI Dashboards
The first step is to connect your existing dashboards to Embedportal. One of our core strengths is that we do not force you to rebuild your dashboards or migrate to a new BI platform. Whether your data team has built visualizations in Tableau, Power BI, Metabase, or QuickSight, we can ingest them instantly.
To do this, navigate to the Data Sources tab inside the Embedportal dashboard:
- Select your BI vendor from our list of Best Embedded Analytics Tools.
- Input your credentials (such as an API key, service account token, or secret key).
- Select the specific dashboards and reports you wish to make available for embedding.
Once connected, Embedportal acts as a unified management layer, allowing you to organize, secure, and style dashboards from multiple different BI tools under a single, cohesive portal.
Step 2: Configure Row-Level Security and Multi-Tenancy
With your dashboards connected, we must now ensure that each customer can only see their own data. We achieve this by configuring Row-Level Security (RLS) rules that map directly to the claims inside your JWT payload.
Inside Embedportal, you can define a global security rule for your connected dashboards. For example, if you are querying a PostgreSQL database, you can write a rule that automatically appends a filtering clause to the underlying queries:
WHERE tenant_id = :tenant_id
When a user from “Client A” views the dashboard, their JWT will contain { "tenant_id": "client_a" }. Embedportal intercepts the query, injects the value securely, and returns only Client A’s data.
This means you only have to build a single dashboard template. Our platform handles the complex job of dynamically filtering the data for hundreds of different clients on the fly. To understand how this fits into your overall software budget, check out our guide on Embedded Analytics Pricing.
Step 3: Apply White-Label Styling and Embed
To deliver a truly native customer experience, the embedded dashboard must blend seamlessly into your application’s design system.
Inside the Embedportal styling manager, you can completely customize the visual presentation of your embeds using White Label Analytics controls:
- Remove Vendor Branding: Strip out all references to Embedportal or the underlying BI tool.
- Custom Fonts and Colors: Bind your application’s CSS variables to the dashboard’s background, text, and chart color palettes.
- Custom Domains: Host your embedded dashboards on your own subdomain (e.g.,
analytics.yourcompany.com) to ensure complete brand alignment.
Once styled, simply copy the generated integration snippet and paste it into your frontend code. Whether you are using React, Angular, Vue, or vanilla HTML, your polished, secure, and fully branded dashboards will render beautifully in seconds.
Frequently Asked Questions About Fast Embedded Analytics
Implementing customer-facing analytics often raises questions regarding performance, security, and long-term costs. Below, we address some of the most common questions SaaS product teams ask when looking to deploy fast embedded analytics.
How long does it actually take to set up embedded analytics?
If you choose to build your own analytics infrastructure, the process typically takes three to six months of dedicated engineering time.
However, if you utilize a managed platform like Embedportal, you can easily embed analytics under hour. Because we handle the complex engineering challenges—such as multi-tenant isolation, token authentication, and white-labeling—out of the box, your developers only need to connect your BI tool, configure security rules, and drop our lightweight iframe or SDK snippet into your application.
This rapid deployment allows you to validate customer demand and ship production-ready reporting features in a single afternoon.
How does multi-tenant data isolation prevent data leaks?
A common security concern is whether a clever user can manipulate the frontend code to access another customer’s data.
With Embedportal, this is mathematically impossible. We enforce tenant isolation strictly at the data layer, not the user interface layer. When a user requests a dashboard, your backend generates an encrypted, signed JWT that contains the user’s specific tenant identifier.
Because the token is signed using a secret key stored safely on your backend server, the client’s browser cannot alter its contents. When the request reaches our servers, we decrypt the token, verify its integrity, and apply row-level security rules directly to the database queries before retrieving any data. This ensures absolute isolation and complete protection against unauthorized data access.
What are the hidden costs of building custom embedding infrastructure?
While utilizing open-source or free BI tools might seem cost-effective initially, the hidden costs of managing your own embedding infrastructure add up incredibly fast.
For example, maintaining a free, self-hosted BI instance typically costs between $18,000 and $48,000 per year in hidden engineering time. This includes the hours spent setting up servers, managing security patches, debugging query performance issues, and manually building custom features like PDF exporting or scheduled email reporting.
Furthermore, you must factor in the massive opportunity cost of pulling your top developers away from your core product features to build reporting infrastructure. To get a transparent breakdown of how to budget for these features, you can read How Embedded Analytics Pricing Actually Works in 2026.
Conclusion
In 2026, delivering high-quality, native analytics is no longer a luxury—it is a baseline requirement for building a successful, high-retention B2B SaaS product.
However, your engineering team should not be wasting valuable cycles building chart libraries, managing complex SSO flows, or writing custom multi-tenant security layers from scratch.
By partnering with Embedportal, you can leverage our powerful, white-label embedding platform to connect your existing Tableau, Power BI, Metabase, or QuickSight dashboards and bring them directly into your application in under an hour. We handle the heavy lifting of unified branding, SSO integration, and robust Row-Level Security, so your team can stay focused on building the core features that make your product unique.
Are you ready to delight your customers with beautiful, native dashboards today? Skip the months of development and schedule a demo or start your free trial with Embedportal to launch your embedded analytics before the hour is up!