
Power BI embedding sounds simple until you try to ship it. You just want your dashboard to show up inside your app, match your product, and only show each customer their own data. Then licensing, tokens, capacity, and tenant isolation walk into the room. This guide explains Power BI embedding in plain English, shows the two main paths, and helps you avoid the expensive mistakes.
Power BI embedding means placing Power BI reports, dashboards, or visuals inside your website, portal, or application instead of sending users to the Power BI service. In practice, it is embedded analytics: analytics delivered inside the flow of work, where users already are. That shift matters because embedded analytics is quickly becoming a default product feature, with 60% of new business apps expected to include it by 2027.
What you’ll learn in this guide:
- What Power BI embedding is
- Internal vs external embedding
- How the embed flow works
- Security and multi-tenant basics
- Licensing and pricing traps
- Implementation steps
- Tradeoffs and maintenance
- When another approach fits better
What Power BI Embedding Actually Means
At the simplest level, Power BI embedding is about showing analytics inside your own experience. Instead of pushing users to app.powerbi.com, you load a report, dashboard, tile, or visual directly inside your site or software.
That sounds like a presentation detail, but it changes the whole product experience. Analytics stops being a separate destination and becomes part of the job someone is already doing, like checking account usage in a customer portal at 8:43 on a Tuesday morning or reviewing pipeline health inside a sales tool before a meeting.
Here’s the thing: embedding is not a workaround anymore. Microsoft documents it as a supported application scenario using REST APIs and SDKs, not a hack taped together with iframes and hope. It also lines up with a bigger market shift, because software buyers increasingly expect self-service reporting inside the product itself, not in a separate BI tab.
The Two Main Embedding Paths: Internal Users vs External Customers
Most confusion around Power BI embedding starts because two very different scenarios get lumped together under one phrase. One is for people inside your company. The other is for people outside it. The code may look similar in places, but the architecture, licensing, and security model do not.
Embed for your organization
This path is for signed-in employees using your internal tools, intranet, or operational apps. Users already exist in your Microsoft environment, usually already have Power BI or Microsoft 365 identities, and can authenticate through your organization.
That makes setup much simpler. You can rely on existing user accounts, existing permissions, and standard Power BI sharing patterns. For internal dashboards, this often works well. If your finance team needs reports inside a SharePoint page or your operations staff needs analytics inside an internal app, this is usually the quickest route.
The catch is that it starts to feel limiting once you want true product-like control. Branding is lighter. User assumptions are still tied to Microsoft identity. And if your audience is customers, partners, franchisees, or portal users outside your tenant, this is usually the wrong fit.
Embed for your customers
This is the external-facing model, and it is what most businesses actually mean when talking about Power BI embedding. Your app owns the experience. Your customer logs into your portal or SaaS product, not into Power BI in the usual sense.
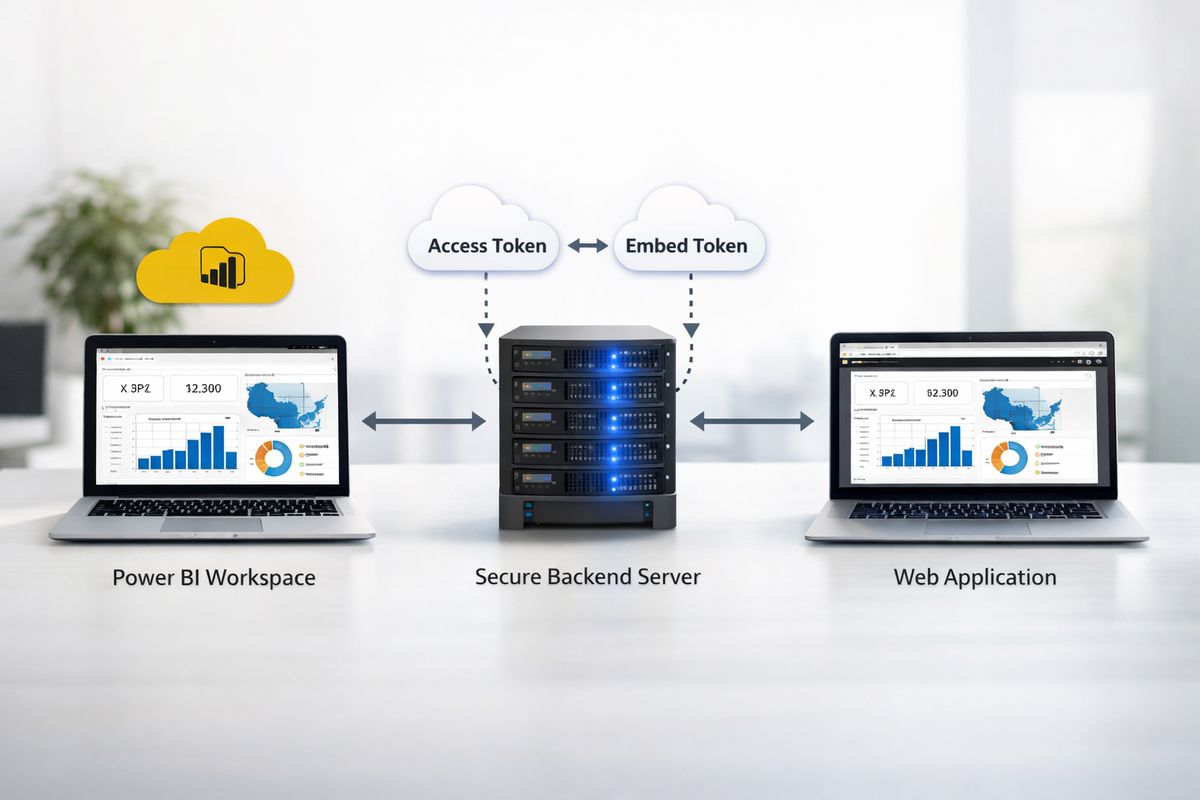
Your backend authenticates to Power BI, generates the right embed token, and serves the report securely inside your UI. Done right, the customer never sees Microsoft chrome, never needs a normal Power BI account, and only sees data allowed for that account.
This is why Power BI Embedded is so common in SaaS analytics. It supports customer dashboards, partner reporting, and white-label analytics without forcing every end user into your Microsoft tenant. But this is also the harder path. You take on more responsibility for identity flow, row-level security, token handling, capacity planning, and long-term operations. External embedding is hard mode. That is just true.
A quick side-by-side decision check
If your users are employees with Microsoft identities, embed for your organization is usually enough. If your users are external customers, embed for your customers is almost always the right path.
Internal embedding is lighter on engineering and often lighter on cost, but it gives you less control over the full product experience. External embedding is more scalable for SaaS and client portals, gives you far better branding control, and avoids requiring a Power BI account for each customer user. In exchange, implementation effort jumps. Security also becomes more architecture-heavy, especially if you need multi-tenant isolation.
A simple decision rule helps: if the analytics lives inside your product and supports people who pay you, build for external customers.

How Power BI Embedding Works Behind the Scenes
Once you understand the moving parts, Power BI embedding feels less mysterious. It is basically a handoff between your content in Power BI, your backend, and your front end.
The core pieces: reports, workspaces, tokens, and capacity
Reports are the interactive analytics experiences users click through. Dashboards are collections of visuals, though reports are the more common choice for embedded apps because they are more interactive and flexible.
Workspaces are where your content lives in the Power BI service. Think of a workspace as the staging area that stores reports, semantic models, dashboards, and permissions.
Tokens do the access work. Your backend usually gets an Azure AD, now Microsoft Entra, access token to talk to the Power BI APIs. Then it generates an embed token, which gives the front end temporary permission to display a specific report for a specific viewing context.
Capacity is the compute layer behind the scenes. For customer-facing embedding, dedicated capacity matters because it keeps your app from relying on shared resources meant for casual BI usage. It is the engine room, not the paint job.
How the embed flow works step by step
The usual flow starts with building a report in Power BI Desktop and publishing it to a workspace. After that, your app registers in Microsoft Entra, your backend authenticates, and your server calls the Power BI REST API to get the details needed for embedding.
Next, the server generates an embed token. Your front end receives the embed URL, report ID, and token, then loads the report using Microsoft’s JavaScript client. The report renders inside a container in your app, and users interact with it as if it belongs there.
That is the high-level version. The real work is in all the details around identity, token expiration, permissions, and data filtering. Still, the sequence itself is straightforward, which is why many teams underestimate the operational side at first.
Common embed types you can use
Most websites and apps embed full reports. That is the standard choice because users can filter, drill, cross-highlight, and move through pages without leaving your product.
Dashboards and tiles can also be embedded, but they are less common for serious product experiences. Single visuals are useful when you just need one KPI chart inside a workflow screen, like account health inside a support portal or inventory status inside an internal tool.
If your goal is customer-facing analytics, interactive reports are usually the right fit. They feel more complete and save you from stitching together lots of separate visual embeds.
Common Use Cases for Websites, Portals, and SaaS Apps
Embedding makes the most sense when analytics belongs inside someone’s normal workflow. Not as a detour. As part of the job.
Customer portals and account dashboards
This is the classic use case. A customer signs into a portal and sees usage, billing, project status, compliance metrics, or revenue performance tied to that account. The report is filtered to the right customer and feels like part of the account area, not like a separate BI tool.
That pattern shows up everywhere, from logistics dashboards to compliance portals to customer success scorecards. Power BI is often deployed on specialized subdomains for exactly these kinds of operational analytics experiences.
Internal apps and business tools
Internal embedding works well when staff already live inside a business application and need data without switching tabs. Think order operations, service management, finance approvals, or supply chain workflows.
This is where embedded analytics really earns its keep. Instead of sending someone to a reporting portal, you put the insight next to the action. A warehouse manager sees delayed shipments in the same screen used to reroute stock. A sales lead checks team performance inside the CRM workflow. Less hopping around, faster decisions.
White-label analytics for SaaS products
White-labeling is a huge reason teams choose embedding. Your customers want analytics that looks like your product, not a Microsoft-branded experience dropped into the middle of it.
Power BI can support branded customer-facing reports, and Microsoft positions it as a way to deliver branded reports in apps. But getting that polished white-label feel usually takes more than basic embed code. You need theme alignment, layout choices, pane control, and careful UI integration so the report feels native.
What You Need Before You Start
The setup list is not tiny, but it is manageable once you break it into parts.
Microsoft Entra tenant, Power BI account, and workspace setup
You need a Microsoft Entra tenant, which is Microsoft’s identity system formerly called Azure Active Directory. This is the foundation for authentication and app registration.
You also need a Power BI account with the right permissions to create content and manage workspaces. Then you need at least one workspace where your reports and semantic models live. No workspace, no content to embed.
Authentication choice: service principal vs master user
This choice matters more than it looks.
A master user is a normal Power BI user account that your app uses to authenticate. It still shows up in older tutorials and quick proofs of concept because it is easy to understand.
A service principal is an app identity. For production, this is usually the cleaner path because it avoids tying your integration to a human user account. Microsoft’s documentation explicitly points developers toward service principal embedding for application scenarios, and that is usually the better long-term call.
Azure or Fabric capacity for production
For testing and small internal setups, shared capacity may be enough. For serious external embedding, production usually means dedicated capacity through Azure or Fabric.
Here is the licensing catch that trips people up: smaller Fabric capacities from F2 through F32 still require viewers to have Pro or Premium Per User licenses. That surprises a lot of teams. F64 and above changes that for consumers, which is why production planning cannot stop at “the embed works.”
Security, Permissions, and Multi-Tenant Access
This is where nice demo videos stop being useful. Security is the part that decides whether your product is trustworthy.
Row-level security and tenant isolation
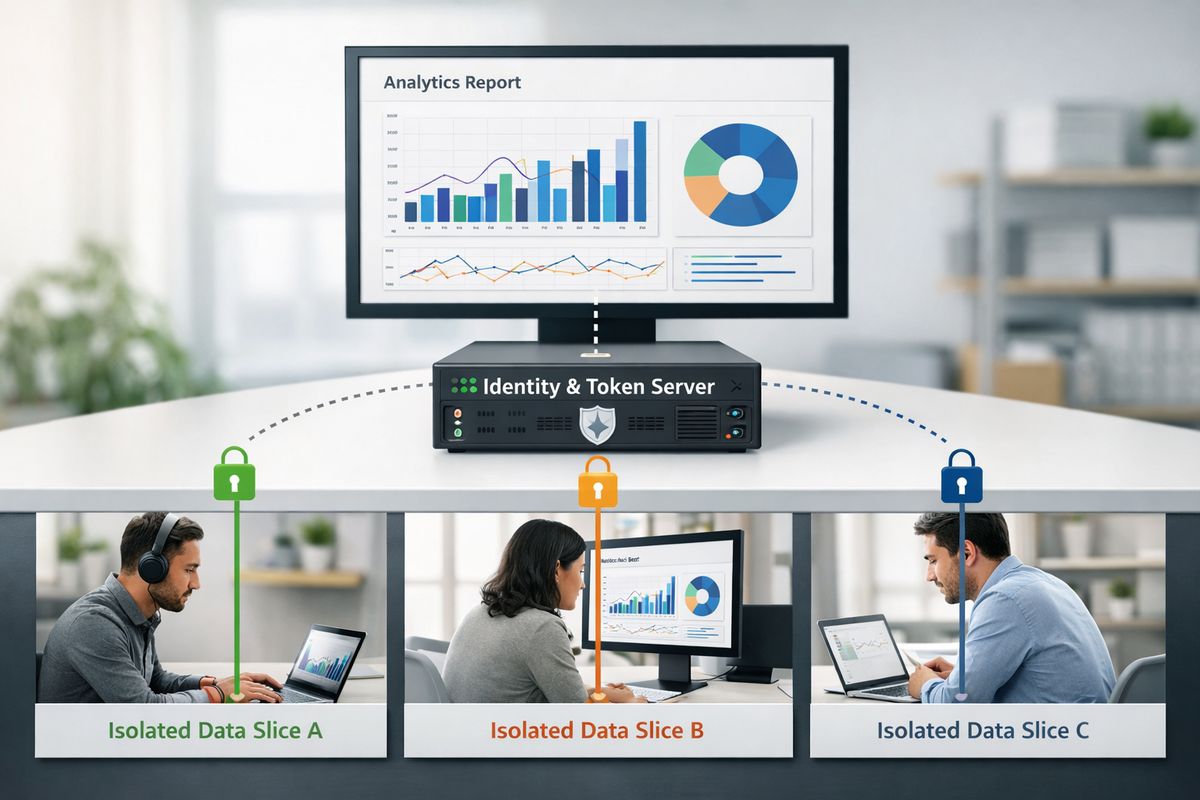
Row-level security, usually shortened to RLS, means one report can show different data depending on who is viewing it. Same report shell, different data slice.
That is how a multi-tenant customer portal works without giving every customer a separate report. Customer A signs in and sees only Customer A data. Customer B signs in and sees only Customer B data. For many SaaS apps, this is the backbone of tenant isolation.
But isolation is not just a report setting. Your data model, identity mapping, token generation, and workspace strategy all need to agree. If one part drifts, your risk shows up fast.
Embed tokens, access tokens, and identity flow
The names sound similar, which is annoying. An access token is usually what your backend uses to call Power BI APIs. An embed token is what allows the report to be displayed in your app.
That separation matters. Your server handles the trusted conversation with Microsoft. Your front end gets only what it needs to render the content for a limited time. Since tokens expire, refresh logic becomes part of the app, not an edge case you can ignore.
Governance, compliance, and auditability
Polished visuals do not cancel weak governance. Embedded analytics still needs clear workspace roles, dataset lineage, audit logging, and permission reviews.
If your environment has compliance pressure, this gets even more serious. Audit trails, sensitivity labels, and controlled semantic model design matter because embedded reporting is still reporting. It just wears your UI instead of Microsoft’s.
Licensing and Pricing Without the Fog
Pricing confusion is probably the most common reason Power BI embedding goes sideways late in the process.
Power BI Pro, Premium Per User, Premium, and Embedded/Fabric capacity
Power BI Pro is the standard per-user license for sharing and collaboration. Premium Per User adds more advanced capabilities for licensed individuals. Premium used to be the big dedicated-capacity label many teams knew best.
For embedding, the key concept is dedicated capacity, now increasingly tied to Fabric SKUs and Azure-based embedded capacity. Internal use often leans on per-user licensing. External embedding leans on capacity-based licensing because your customers should not need individual Power BI licenses in the normal model.
When costs stay manageable and when they spike
Costs stay reasonable when your audience is small, concurrency is low, and your architecture matches your user type. If you size for internal sharing and then quietly grow into a customer-facing analytics product, cost surprises show up quickly.
They also spike when you underestimate concurrency. Embedded analytics is not billed by how pretty the dashboard looks. It is shaped by how often users hit it, how complex the models are, how heavy the DAX queries become, and how many customers are active at once.
Capacity planning and usage monitoring
Capacity planning is not just finance work. It is product reliability work.
If multiple tenants share the same capacity, one heavy query can affect everyone else. That shared-compute behavior is a real reason some SaaS teams struggle at scale. Monitor refresh patterns, concurrency, throttling, and memory pressure early. Microsoft provides multiple monitoring paths, including admin tools and Azure diagnostics, but the main point is simple: if nobody watches capacity, your users will do it for you by filing bug tickets.
How to Embed Power BI in a Website or App
This is the part most searchers want. The broad implementation path is simple enough to map clearly.
Basic implementation flow for developers
Create your report and publish it to a workspace. Register your application in Microsoft Entra. Set the API permissions you need. Decide on service principal or master user authentication.
Then build a backend endpoint that authenticates, calls the Power BI REST API, and generates embed parameters and an embed token. On the front end, use the JavaScript client to load the report into your page. After that, test with realistic permissions, not just admin credentials, because fake-happy demos hide real security bugs.
Customizing the embedded experience
This is where the experience starts to feel native. You can hide panes, pre-set filters, apply themes, control navigation, and react to report events in your UI.
Small changes matter. A report with the filter pane removed, the right theme colors, and app-level controls around it feels like part of your product. The same report dropped in raw feels like a guest window. Same data, very different experience.
Performance and mobile responsiveness
Performance usually comes down to model design, visual count, query complexity, and screen fit. Too many visuals on one page, inefficient measures, or wide desktop layouts stuffed into a phone viewport will make even a solid embed feel clumsy.
Keep pages focused. Use optimized models. Test inside the real container sizes of your app, not just in a full browser tab. Mobile responsiveness is not automatic just because the report technically loads.
Pros, Tradeoffs, and Hidden Maintenance Work
Power BI embedding is powerful. It is also not “paste code and done.”
Why teams choose Power BI embedding
The upside is obvious. You get mature visuals, interactive reporting, Microsoft ecosystem fit, and a faster route than building a reporting engine from scratch.
That is a strong package, especially if your stack already leans Microsoft. Power BI also sits inside a much larger ecosystem advantage with Microsoft 365 and Azure data services, which is one reason it keeps showing up near the top of the embedded analytics market.
Where teams get stuck
The pain points are predictable: licensing fog, branding limitations, semantic model complexity, token refresh, API changes, and capacity throttling. External embedding adds another layer because identity and multi-tenant security stop being side notes and become the architecture.
If your app serves external users, expect more engineering than the happy-path demos suggest. Some teams spend months building the surrounding infrastructure, not the dashboard itself.
The ongoing operational burden
Once live, you still have real work to do. Monitor capacity. Rotate and manage identities. Update reports without breaking customer views. Keep RLS rules aligned as products and account structures change.
That burden is manageable, but only if you treat embedded analytics like a living product feature. If you treat it like a one-time integration, it gets brittle fast.
Power BI Embedded vs Other Ways to Share Analytics
Not every reporting problem needs true embedding.
Embedded vs publish to web vs secure portal sharing
Publish to web is public. Full stop. It is for content you are comfortable exposing to the internet. It is not for customer-specific reporting, private financials, or partner dashboards.
Secure embedding and portal sharing are different because access is controlled and content stays protected. If you need private data inside a login experience, publish to web should be off the table immediately.
Power BI Embedded vs Power BI Premium
These terms overlap enough to confuse almost everyone. Power BI Embedded usually describes the application-facing embedding scenario, especially for customers. Premium historically referred more broadly to dedicated capacity and advanced enterprise capabilities.
In practice, the real question is less about labels and more about deployment model. Are you serving internal licensed users, or external users through your app? That answer matters more than the marketing names.
When to consider an alternative approach
Sometimes another route fits better. If your biggest headache is multi-tenant architecture at scale, shared-capacity behavior, or heavy white-label demands, it is worth comparing other embedded analytics products or a platform layer on top of Power BI.
The trick is to evaluate the hard parts, not the demo parts. Test tenant isolation, theming, heavy-query behavior, and concurrency with multiple customers at once. A single-tenant proof of concept can look great right up until production.
Best Practices for a Clean, Scalable Embedded Analytics Experience
Good embedded analytics ages well. Fragile embedded analytics turns into a support problem.
Treat analytics like a product feature
Design it like part of your app from day one. Permissions, navigation, branding, support flows, and data ownership should all be thought through before launch.
That mindset shift matters because embedded analytics is moving beyond static reporting and into guided decisions, self-service exploration, and even conversational analytics. If analytics affects product value, it belongs in product thinking.
Start small, then harden for production
Start with one report and one audience. Get the basics right. Then add RLS, token refresh handling, monitoring, capacity planning, and UX polish before scaling wider.
That sequence saves pain. It is much easier to harden one clean embed than to untangle a sprawling set of half-finished customer dashboards later.
One smart next step to try
Pick your user type before touching code: internal staff or external customers. That single decision shapes your licensing, security model, architecture, and rollout plan more than any SDK choice ever will.
Make that choice first, and the rest of Power BI embedding gets a lot less foggy.