Shared dashboard access sounds simple until the wrong customer sees the wrong row. One dashboard for everyone is absolutely doable, but only if row-level security is wired into the data, the BI tool, and the sign-in flow from the start.
What shared dashboard access actually needs to work
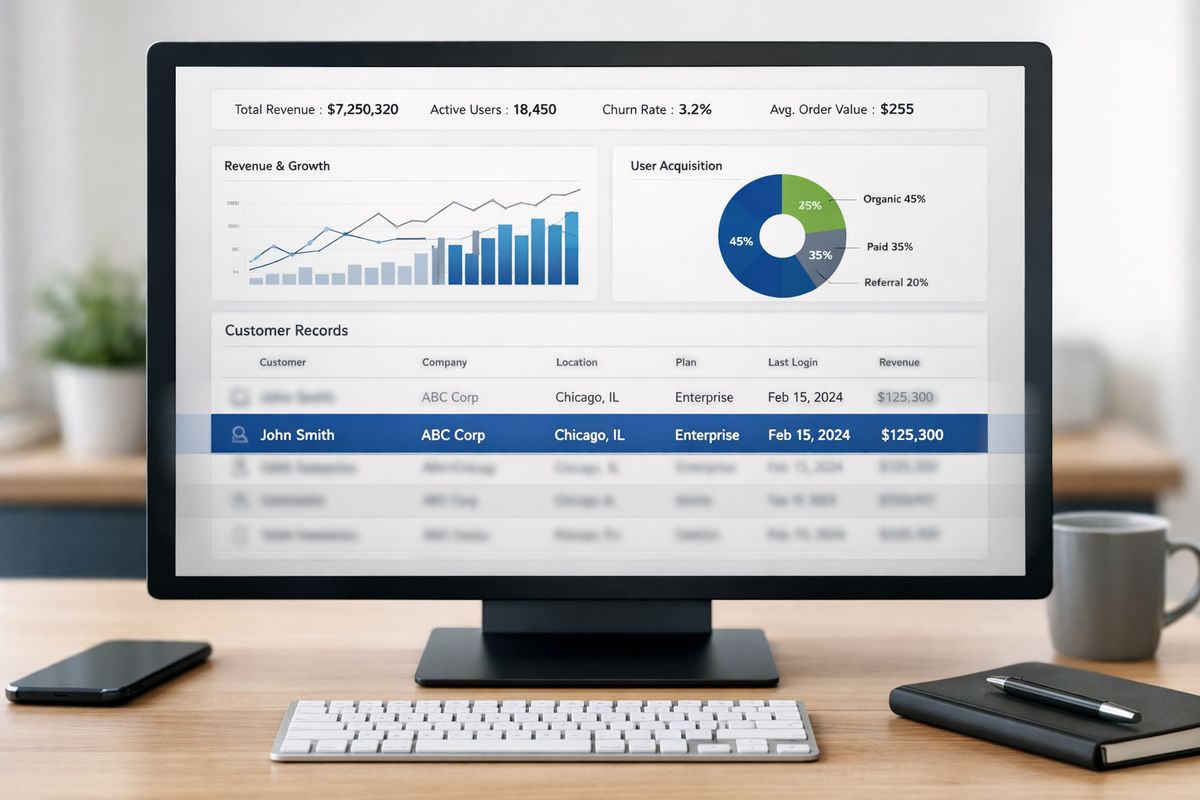
The goal is straightforward: every customer opens the same dashboard experience, but each one only sees the data tied to that account. No duplicate dashboards. No manual swapping. No nervous refresh right before a demo at 4:47 p.m.
That only works when row-level security, usually shortened to RLS, filters every query based on who is signed in. If the dashboard is shared but the data rules are loose, the setup is not shared access. It is a leak waiting to happen.
What you’ll need before you start
Before Step 1, make sure the basics are in place. You need a BI tool that supports RLS, such as Tableau, Power BI, or AWS QuickSight. You also need a stable user identifier, tenant-aware data, and a clear login flow.
Your dashboard platform and data model
The dashboard tool is only half the job. Your data model needs fields the security layer can actually use, such as customer_id, tenant_id, account_id, region, or role. If those keys are missing or inconsistent across tables, the dashboard cannot reliably know what to hide.
A shared dashboard with clean tenant keys is far easier to secure than a pile of report-specific fixes. If you want a deeper look at the pattern, this guide on avoiding duplicate dashboards across tenants lays out the logic clearly.
A source of truth for users and permissions
You need one place that says which user can see which tenant, region, or account. That can live in your app database, an identity provider, or a dedicated entitlement table. The format matters less than the discipline. It needs to stay current.
A clear definition of tenant access
Tenant access means one simple thing: which slice of data each signed-in user can view. Decide that before setup begins. If access rules get invented during testing, the security model turns into duct tape.
Step 1: Map who should see what
Start by translating business rules into data access rules. This is where a lot of RLS projects either stay clean or get messy for months.
- Write down every audience type that will use the dashboard.
- Define the exact data scope for each one.
- Flag any exceptions before building roles.
List your audience types
Most setups include customer admins, standard customer users, internal support, and leadership. Those groups often use the same dashboard but need different visibility. A customer admin may see every record for one account, while support may need temporary visibility across several.
Choose the field that will drive RLS
Pick one primary field for filtering, usually tenant_id or customer_id. It should be stable, unique, and available anywhere the dashboard pulls data from. If one chart filters on account_id and another relies on region with no tenant bridge, cracks show up fast.
Decide on exceptions before they become problems
Some users belong to multiple accounts. Some internal roles need wider access. Some partner managers need five customers, but not six. Define those cases now, not later. If you want a plain-English refresher on who should see which dashboard data, keep that model nearby while mapping roles.
Step 2: Prepare your data for row level security
Clean structure beats clever workarounds every time. RLS depends on predictable joins and consistent keys.
- Confirm tenant identifiers exist in every relevant table.
- Build an access mapping table.
- Test for bad data before publishing.
Add or validate tenant identifiers in every relevant table
Every fact table and every dimension involved in filtering should include the right tenant key, directly or through a reliable join. If one supporting table is missing that key, a visual can break security quietly. Quiet failures are the worst kind.
Create an access mapping table
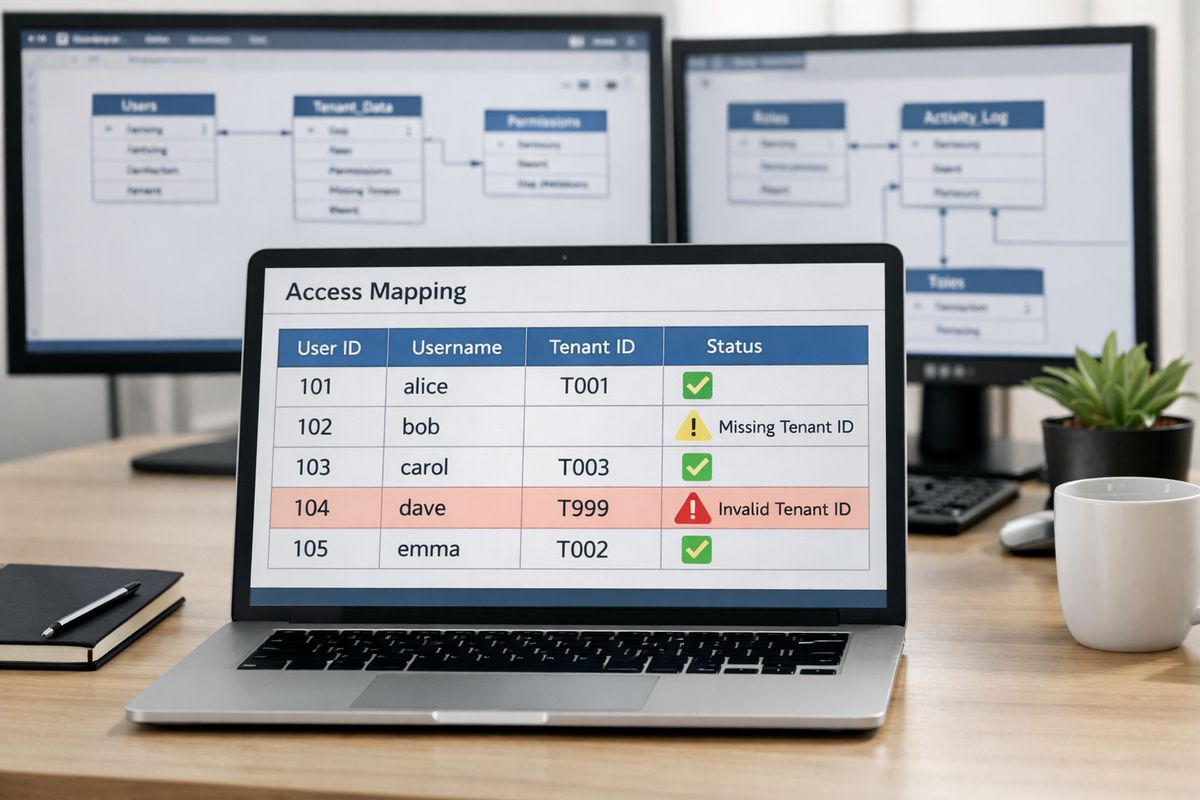
Build a simple table that links user identity to tenant identity. For example, email or user_id on one side, tenant_id on the other. If access is region-based or role-based, include those fields too. This table becomes the bridge between sign-in and filtered results.
Test for messy data before you publish
Check for null IDs, duplicate user mappings, mismatched formats, and inconsistent casing. Think of it like labeling house keys. If two keys look the same but open different doors, the mistake only shows up when somebody is already locked out, or worse, inside the wrong room.
Step 3: Set up RLS in your BI tool
Now connect user identity to the access rule inside the reporting layer. The pattern is the same across platforms: identify the signed-in user, match that user to allowed data, and apply the filter automatically.
- Create the security rule in the BI tool.
- Tie the rule to a user attribute or mapping table.
- Validate it with non-admin test accounts.
Tableau: Use user filters or entitlement tables
In Tableau, user filters can be driven by username functions, calculated logic, or entitlement-table joins. The cleaner setup is usually an entitlement table, because it scales better and is easier to inspect later. The result should be simple: signed-in users only see rows tied to allowed accounts.
Power BI: Create roles and map users to data
In Power BI, create roles and apply DAX filters based on the signed-in identity. Keep the expressions readable. A role you cannot explain in one minute is a role that will be painful to debug in three months. For a broader breakdown of how row-level filtering works in embedded analytics, it helps to compare the shared pattern before getting tool-specific.
AWS QuickSight: Apply rules-based security
QuickSight supports row-level permissions through rules datasets and related controls. It works best when the user-to-tenant mapping is maintained outside the dashboard and refreshed reliably. That keeps reporting focused on rendering data, not acting like a user directory.
Step 4: Connect dashboard access to your app or portal
This is where many setups wobble. The dashboard may be secure on its own, but the handoff from your app to the BI tool has to pass the right identity every time.
- Match application users to BI users.
- Send the right identity context during embedding.
- Reduce manual provisioning.
Match application users to BI users
Your app account and your BI account need a clean match. That can happen through SSO, embedded sessions, or synced user records. If a user logs into your app as one identity but hits the dashboard as another, RLS gets shaky immediately.
Pass the right context during embedding
When the dashboard loads inside your product, pass the correct signed-in identity, token, or session context. That is what turns a shared dashboard into a secure customer experience instead of a public hallway with nicer charts.
Avoid manual user provisioning where possible
Adding BI users one by one does not scale. It also turns user management into the hidden tax on customer-facing analytics. If you are sorting through platform choices, this overview of what matters in an embedded analytics setup helps clarify where provisioning and access control usually get painful.
Step 5: Test access like a real customer would
If you only test as an admin, you have not really tested RLS. Admins often bypass the very rules customers depend on.
- Log in as a single-tenant user.
- Test broader-access roles.
- Verify exports, subscriptions, and cached views.
Test single-tenant users
Use a staging account tied to one customer and inspect every page, filter, and drill-down. For example, if a user belongs to Acme West, confirm no Acme East data appears anywhere, including tooltips and detail tables.
Test multi-tenant and internal roles
Now test users with intentional broad access, such as support leads or account owners. Confirm wider access is coming from the mapping table or role logic, not from a default setting that accidentally opens everything.
Test exports, subscriptions, and cached views
RLS must hold up outside the live dashboard too. Test CSV downloads, scheduled snapshots, subscriptions, and any cached results. This is also a good point to review practical guardrails for external-facing RLS, because leaks often happen in the extras, not the main visual.
Step 6: Roll out shared dashboard access safely
A careful rollout saves support time and awkward customer messages.
- Launch with a small pilot.
- Document the rules.
- Monitor changes to permissions.
Start with a pilot group
Pick a small customer group first. That gives you room to catch bad mappings, weird edge cases, and dashboard behavior that looked fine in staging but acts differently in production.
Document your access rules
Keep a short plain-language record of who gets access to what and why. Nothing fancy. Just enough so product, engineering, and data teams can fix issues without reverse-engineering old logic.
Set alerts for permission changes
Monitor new users, revoked access, stale mappings, and sync failures. Shared dashboard access is not a one-time switch. It needs a light maintenance loop.
Troubleshooting common RLS issues
When something breaks, start with identity and mappings before rewriting the whole model.
A user sees no data
This usually comes from a missing user mapping, wrong login identity, unmatched tenant ID, or a filter that is too strict. Check the runtime identity first. A blank dashboard often means the user arrived correctly, but the entitlement table did not.
A user sees too much data
Treat this as urgent. Common causes include broken joins, broad default roles, fallback accounts, or internal permissions bleeding into external access. One leak can burn trust fast.
Performance drops after adding RLS
Complex permission joins and oversized access tables can slow dashboards down. Simplify the logic, index key fields, and strip out calculations that do not need to run at query time.
Permissions become hard to manage over time
This is the maintenance trap. Manual users across Tableau, Power BI, and QuickSight eventually become a spreadsheet problem with security consequences. Centralizing provisioning and access logic is usually the fix.
What success looks like after setup
When this is working, your customers all use the same dashboard experience, but each one automatically sees only the right data. Your team stops cloning reports for every account. Support questions drop. New customer rollout gets boring, which is exactly what you want from security.
Next step: try a simpler way to manage users and RLS
Try one thing this week: set up a test flow in embedportal.com and see how shared dashboard access feels when user management and RLS live in one place. It can simplify provisioning, access mapping, and secure embedding for Tableau, Power BI, and AWS QuickSight, without turning every new customer into a manual setup task.
Frequently Asked Questions
What is shared dashboard access?
It means multiple customers or user groups use the same dashboard framework, while access rules ensure each signed-in user only sees the rows meant for that account or role.
Is row-level security enough on its own?
No. RLS is the enforcement layer, but it depends on clean tenant keys, reliable user identity, and correct embedding or sign-in context.
Can one user have access to multiple customers?
Yes. That is common for partner managers, support teams, and account owners. The clean way to handle it is through an access mapping table, not custom report copies.
Which BI tool is best for customer-facing RLS?
Tableau, Power BI, and AWS QuickSight can all handle it. The bigger difference usually comes from how cleanly your user provisioning, identity matching, and entitlement data are managed.
Why do RLS issues show up after launch?
Because real usage finds the edge cases. Exports, stale mappings, multi-account users, and cached views often reveal problems that basic admin testing misses.