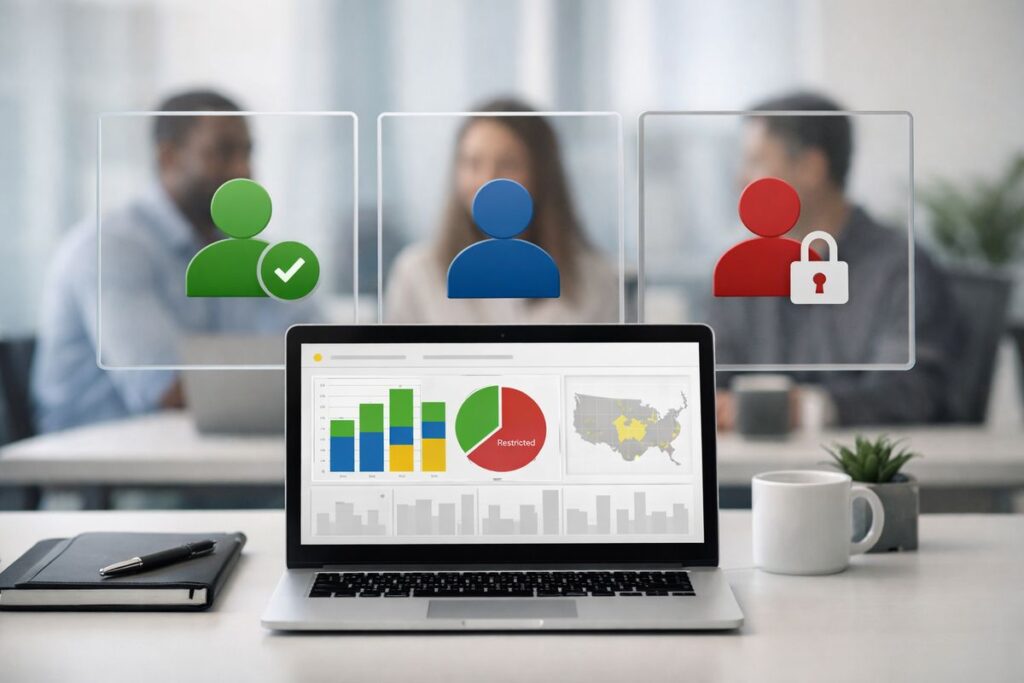
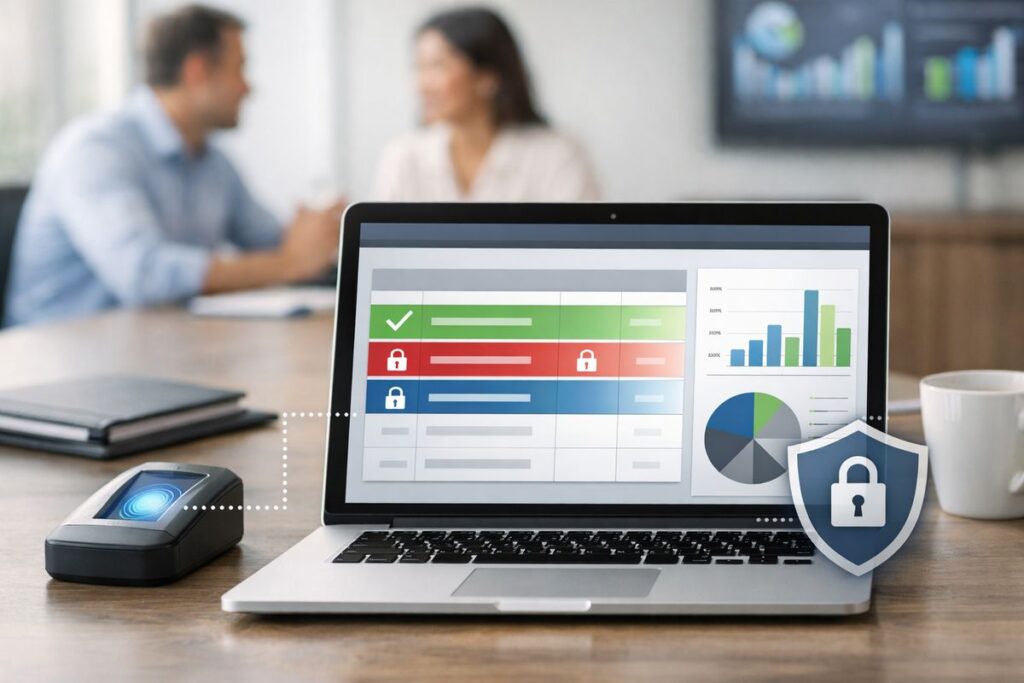
Dashboard data access is the set of rules that decides who can open a dashboard and what data shows up once it loads. If you share one dashboard across many customers, this is the line between a clean product experience and a very bad Monday morning.
What “dashboard data access” really means in a shared dashboard
In a shared dashboard setup, one design often serves dozens, hundreds, or thousands of users. The layout stays the same, but the numbers should not. Your enterprise customer in Chicago should never see another customer’s pipeline, revenue, or support backlog just because both accounts use the same embedded analytics page.
That is what dashboard data access really covers. It is not just “can this person click into the dashboard?” It is also “which records, accounts, regions, or tenants should appear after access is granted?”
Access to the dashboard vs. access to the data inside it
This distinction trips up a lot of teams. A user can have permission to view the dashboard shell, meaning the page opens, menus load, and charts render. But that alone does not guarantee the data inside is restricted correctly.
Think of it like getting into an office building versus opening specific filing cabinets. Building access gets you through the front door. Data access decides which drawers you can open once you are inside. In shared analytics, both controls matter.
A quick primer on row-level security (RLS)
Row-level security, usually shortened to RLS, is a filter layer that shows each user only the records connected to that user, account, team, or customer. If dashboard data access is the big idea, RLS is usually the mechanism doing the hard work underneath.
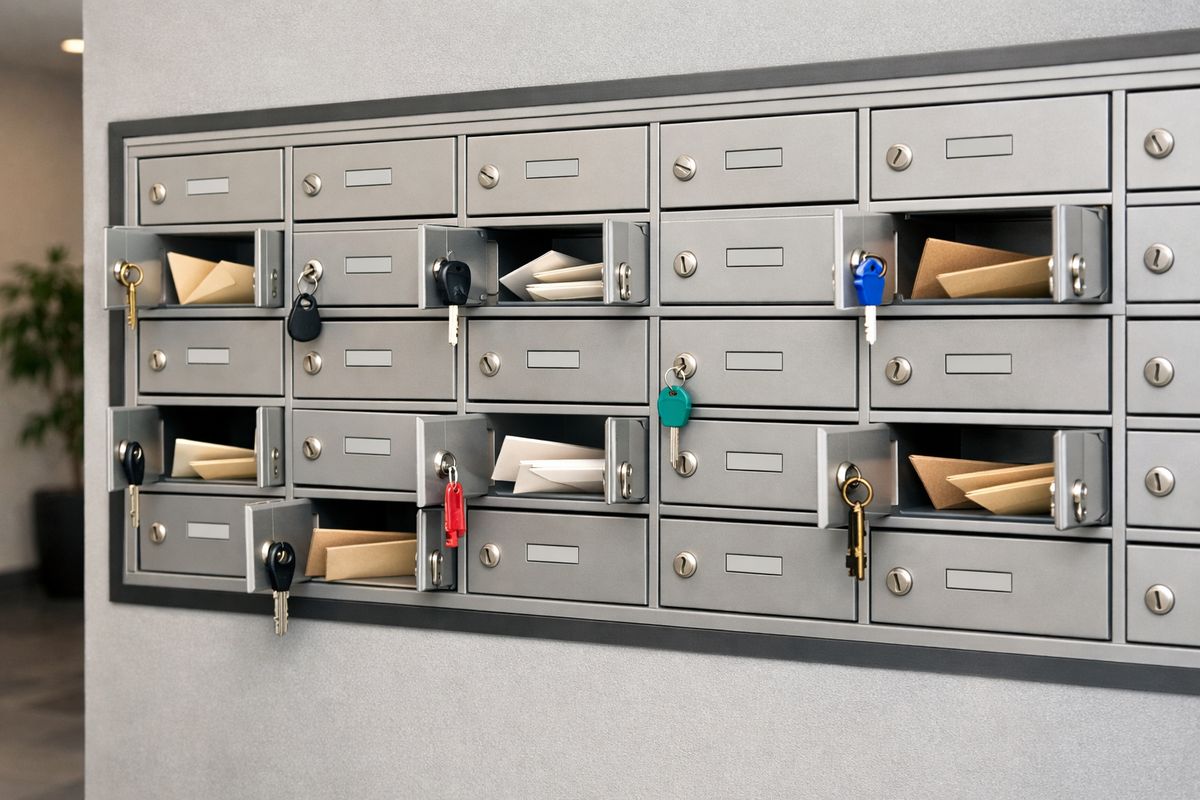
A simple way to picture it: imagine apartment mailboxes in a lobby. Everyone stands in the same room, but each key opens only the right box. That is how good RLS feels in a shared dashboard.
What “row level” means in practice
A row is just one record in a dataset. That record could be one order, one customer, one store location, one subscription, or one sales account. Your charts and KPIs are built from lots of those rows rolled up together.
So if a user is allowed to see only Account A, the dashboard should calculate totals, trends, and tables using only rows tied to Account A. For a deeper walkthrough of how that filtering works in embedded reporting, this plain-English breakdown of the mechanics is a useful companion.
Why RLS is not optional in customer-facing analytics
If multiple customers share one analytics experience, RLS is not a nice extra. It is the thing that keeps the setup safe and usable.
Without it, your fallback is usually dashboard duplication. One copy for Customer A, another for Customer B, then fifty more after that. It sounds manageable on a Friday afternoon. By the next sprint, it turns into version drift, update headaches, and inconsistent numbers across customers.
Who sees what in a shared dashboard?
The short answer is this: each user should see the same dashboard structure, but only the data permitted for that identity and role.
Everyone sees the same layout, but not the same data
This is the standard pattern in Tableau, Power BI, and Amazon QuickSight. You maintain one dashboard design, one set of visuals, and one logic layer for metrics. Underneath, identity or entitlement rules personalize the results.
That is the whole appeal. Your product stays consistent, while each customer gets a private view.
Common access models you’ll run into
Most setups follow a few familiar patterns. Access may be scoped by customer account, tenant, role, region, team, or account owner. Sometimes those rules stack. A sales rep might see only assigned accounts, while a regional manager sees every account in the territory.
Shared dashboards get much easier to reason about when you document these patterns clearly. If your setup spans multiple tenants, keeping one dashboard while separating customer data cleanly is usually the approach worth aiming for.
What a user session usually needs to include
Behind the scenes, a session usually needs three ingredients: a user identity, a mapping table, and permission rules. Identity answers “who is this?” A mapping table connects that user to allowed accounts or regions. Permission rules tell the BI layer how to filter the dataset before anything appears on screen.
How RLS usually works behind the scenes
https://www.youtube.com/watch?v=aLV4Qe60VK4
The flow is simpler than it sounds. A user logs in, the system identifies that user, matches the identity to allowed records, and applies the filter before the dashboard fully renders.
Step 1: Identify the user
First, your system needs to know who is opening the dashboard. That can happen through single sign-on, embedded authentication, or a passed user ID from your application.
Step 2: Match the user to allowed data
Next, the identity gets matched to allowed rows through a permissions table, entitlement map, or user attributes. Different tools use different labels, but the idea is the same: connect a person to the records that person is allowed to see.
Step 3: Apply filters before the dashboard renders
Then the BI tool enforces the rule before charts load. That part matters. If filtering happens too late or inconsistently, trust disappears fast. Every chart, KPI, drill-down, and export should stay scoped to the same allowed slice.
Where teams get tripped up
Most problems are not caused by the charts. They come from access logic that lives in too many places and gets updated by hand.
Confusing dashboard permissions with RLS
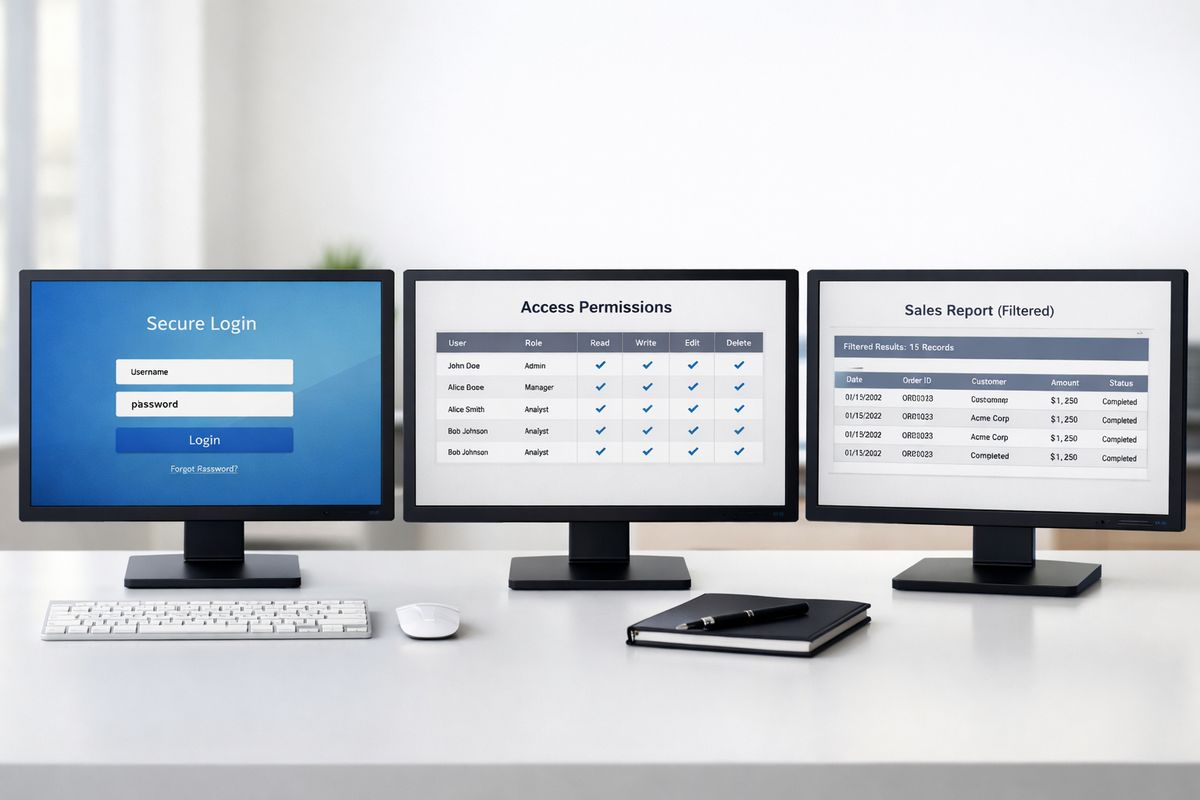
This is the classic mistake. You grant dashboard access and assume the data inside is automatically restricted. It is not. Viewing rights and row-level filtering are separate controls, and treating them as one is how support tickets start.
Managing access in too many places
The catch is that access often gets split across your app, your BI tool, and somebody’s spreadsheet. Onboarding gets messy. Offboarding gets risky. Troubleshooting turns into a scavenger hunt. If that sounds familiar, centralizing the rules in one place usually removes a lot of friction.
Duplicating dashboards for each customer
Cloning dashboards feels quick at first because it avoids designing proper access rules. But every update has to be copied, retested, and checked for drift. That is not a product strategy. It is a maintenance trap.
Forgetting edge cases
Real users rarely fit neat boxes. Parent-child accounts, temporary access, multiple roles, and internal staff with broader visibility all need to be handled on purpose.
How this shows up in Tableau, Power BI, and Amazon QuickSight
Each platform supports RLS, but the operational pain usually grows as your user base grows.
Tableau
Tableau often uses user filters, security tables, and embedded identity patterns to control visible records. It is flexible, though user management can get heavy once external audiences expand.
Power BI
Power BI supports RLS through roles and filter logic tied to users. In embedded setups, identity often gets passed in from the application layer, which keeps things clean if role definitions stay disciplined.
Amazon QuickSight
QuickSight supports row-level security with permission datasets and user-based controls. It works well for multi-tenant analytics, especially when your entitlement mappings stay organized instead of drifting across teams.
What good dashboard data access looks like
Good dashboard data access feels invisible. Users log in and see exactly what belongs to them, no extra clicks, no weird gaps, no accidental exposure.
Signs your setup is healthy
You can usually spot a healthy setup fast: one dashboard serves many customers, onboarding is quick, entitlement logic is clear, and support tickets about “why can I see this?” start to fade. If your team is tightening customer-facing permissions, practical guidance for handling outside users safely helps pressure-test the setup.
A simple test to run this week
Pick three real user types on a Tuesday morning, log in as each, and compare results. The same dashboard should load each time, but the visible rows, totals, and drill-downs should change exactly as intended.
When user management becomes the real bottleneck
Here’s the thing: the BI tool can usually enforce RLS. The harder problem is keeping users, permissions, and customer access changes in sync over time.
Why embedded analytics gets messy fast
Customer admins want self-serve user management. Internal teams want fewer manual updates. Your product needs every access change to flow through cleanly without breaking RLS. That is where delivery gets messy fast, especially once account hierarchies and custom roles enter the picture.
Try a simpler way to handle RLS and user access
If you are delivering customer-facing analytics in Tableau, Power BI, or Amazon QuickSight, EmbedPortal is worth trying. It simplifies user management and makes RLS easier to operationalize, without stitching together identity, permissions, and dashboard access by hand. This week, try mapping one customer access workflow in embedportal.com and notice how much admin work drops away.
Frequently Asked Questions
Is dashboard access the same thing as row-level security?
No. Dashboard access controls whether a user can open the dashboard at all. Row-level security controls which records appear inside it.
Can one dashboard safely serve multiple customers?
Yes, if your access rules are set up correctly. That is the normal pattern for embedded analytics, and it is far easier to maintain than duplicating dashboards.
What kinds of data can RLS filter?
Any record-based data source can be filtered by row. Common examples include accounts, orders, locations, regions, teams, and tenants.
Does RLS happen before charts load?
It should. Good setups apply the filter before visuals render, so every metric and table reflects only the allowed data.
Why do teams struggle with RLS even when the BI tool supports it?
Because the hard part is often user management, entitlement mapping, and keeping permissions current across customers. The filter logic is only one piece of the job.