
Row-Level Security for Embedded Analytics: Who Gets to See What?
Why Row-Level Security Is Non-Negotiable for Embedded Analytics
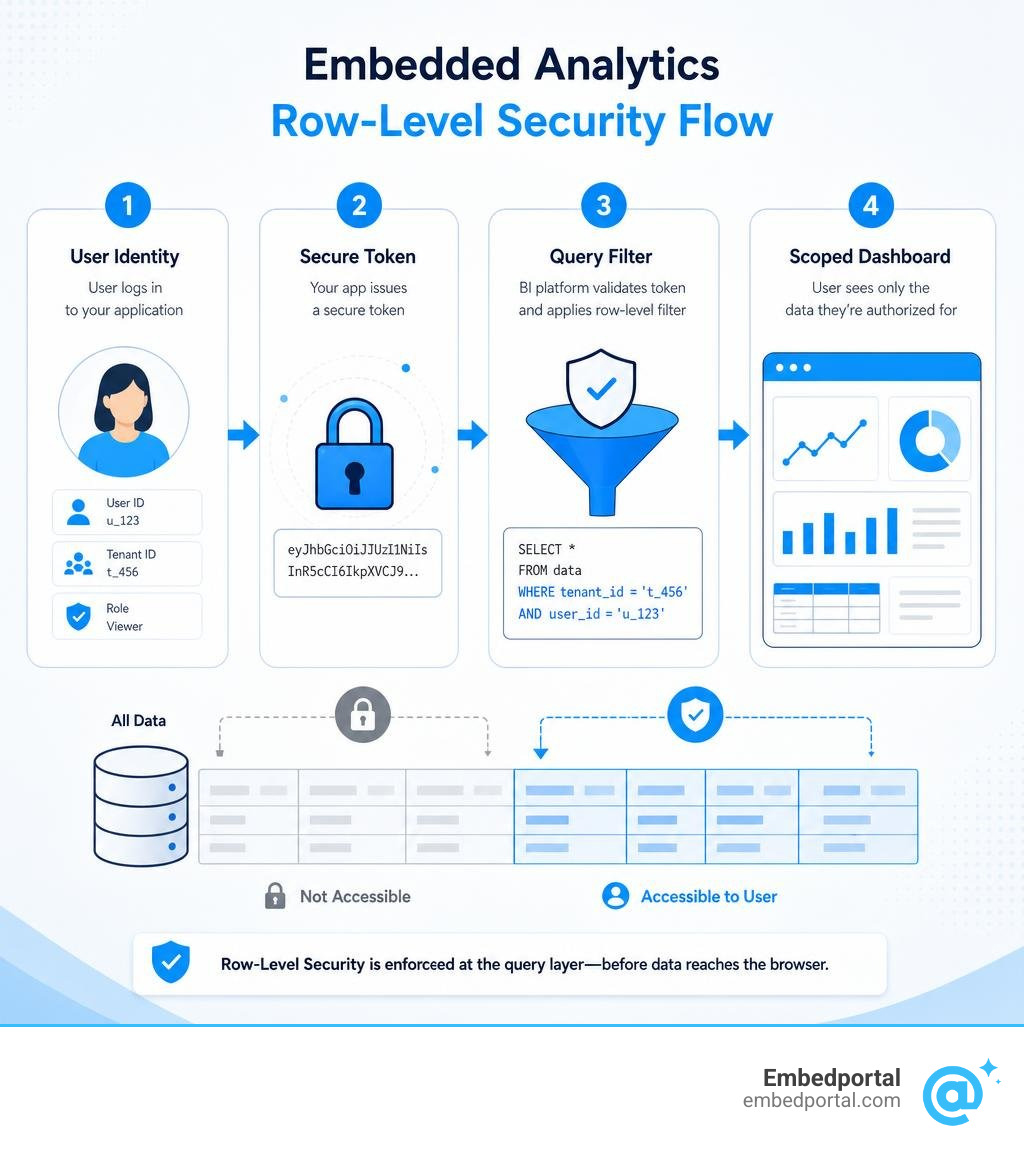
Embedded analytics row level security (RLS) is the mechanism that ensures each user or tenant only sees the rows of data they are authorized to see — enforced at the query layer, before data ever reaches the browser.
If you need a quick answer:
- What it does: Appends a filter (like
WHERE tenant_id = X) to every query, automatically, based on the user’s identity - Why it matters: Dashboard-level filters are just presentation logic — a user inspecting network requests can bypass them entirely
- How it works in practice: Your app passes a user identity (via token or API call) to the BI tool, which maps it to a filter rule and enforces it at query time
- When you need it: Any time multiple users or customers share the same dataset inside an embedded dashboard
For SaaS teams embedding dashboards into customer portals, RLS isn’t optional. Without it, Tenant A can potentially see Tenant B’s data — a trust-destroying event that goes far beyond a simple bug report.
The challenge is that every major BI tool handles RLS differently. Power BI uses DAX roles and embed tokens. Metabase uses user attributes and SQL sandboxing. Holistics uses JWT claims. Managing this fragmentation across a multi-vendor embedded analytics setup is exactly where teams get stuck.
This guide walks through how RLS works at a technical level, the main implementation patterns, and how to get it right — whether you’re embedding Power BI, building a multi-tenant SaaS portal, or trying to unify security across multiple BI tools.
The Core Mechanics of Embedded Analytics Row Level Security
To understand why row-level security is so vital, we first have to look at where traditional data filtering falls short. Many developers starting with embedded dashboards make the mistake of using dashboard-level filters to restrict tenant data.
Dashboard-level filters are purely presentation logic. When a user changes a filter on a dashboard, the browser sends an API request to the BI server requesting the filtered data. If a malicious or curious user opens their browser’s developer tools, inspects the network requests, and modifies the query parameters (for instance, changing tenant_id from 102 to 101), a system relying solely on dashboard-level filters will happily return the other tenant’s data.
True security requires query-layer enforcement. With query-layer RLS, the application server generates a secure, cryptographically signed token containing the user’s identity and attributes. When the BI engine receives this token, it intercepts the query generation process and appends the filtering logic directly to the SQL query (such as adding a WHERE clause) before sending it to the database. This makes the filters completely immutable and invisible to the end-user.
To see the differences clearly, let us compare these two approaches:
| Feature | Dashboard-Level Filters | Query-Layer Row-Level Security |
|---|---|---|
| Execution Location | Browser / Presentation Layer | Database / Query Generation Layer |
| Bypass Vulnerability | High (via network request inspection) | None (enforced before query execution) |
| Data Transmission | Full dataset may be loaded and masked post-hoc | Only authorized rows are fetched |
| Implementation Complexity | Low (simple UI configuration) | Moderate (requires token handshake and data modeling) |
| Primary Use Case | User interactivity and exploration | Tenant isolation and data privacy |
When you rely on post-hoc masking or application-level filtering, the database still reads the full, unfiltered dataset, and the BI tool attempts to hide the unauthorized rows after the fact. This is structurally weak, degrades performance, and leaves open the “confused deputy” problem where the database executes queries under a highly privileged service account without understanding who the actual end-user is. For a complete deep dive into how these security concepts connect, take a look at The Ultimate Guide to Row Level Security RLS and explore What Is Row-Level Security for Embedding? to see why query-time injection is the industry standard.
Architectural Patterns for Implementing Row-Level Security
When designing your database and semantic layer for a multi-tenant SaaS application, there are four primary design patterns used to enforce embedded analytics row level security.
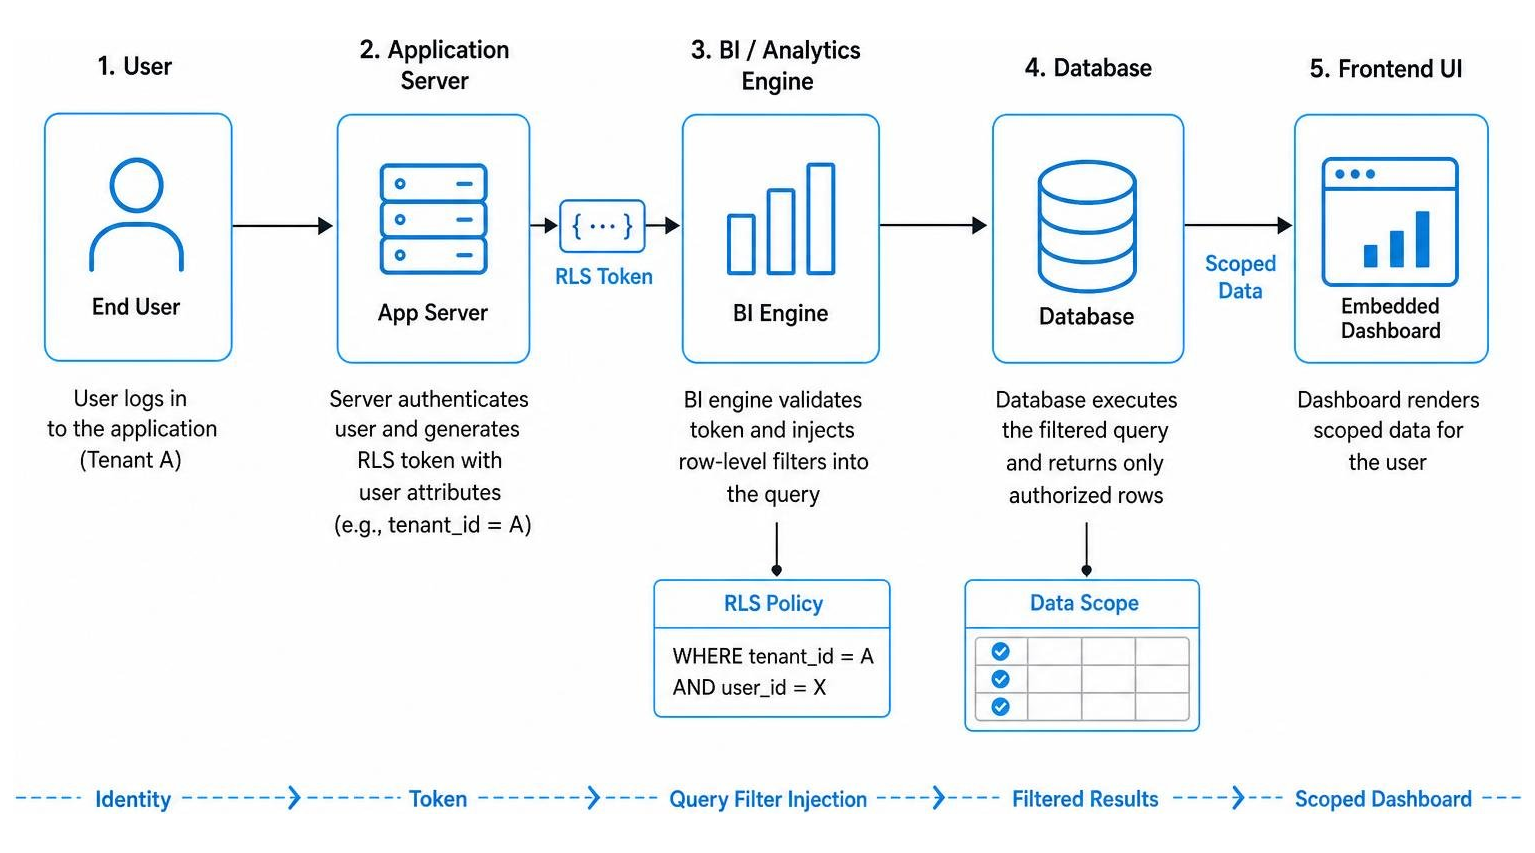
1. Single-Column Tenant Filter
This is the simplest and most common pattern. Every tenant-specific table in your database contains a tenantid or customerid column. When a user requests a dashboard, your application passes their tenantid in the security token. The BI tool maps this attribute directly to the table and automatically appends WHERE tenantid = currentusertenant_id to every database query.
2. Role-Based Policy Tables
For complex organizational hierarchies, a single column is rarely enough. In this pattern, you maintain a dedicated mapping table in your database (e.g., userroles or accountassignments) that links user identifiers to specific entities, regions, or departments. The BI engine performs a join between the data tables and this policy table at query time, filtering rows based on the logged-in user’s active roles.
3. Attribute-Based Rules (ABAC)
Attribute-Based Access Control (ABAC) uses dynamic user metadata—such as geographic region, department, or subscription tier—to determine access. For example, a regional manager might have the attribute regions = [US-East, EU-West]. The BI tool parses this array from the user’s token and uses an IN operator in the SQL query to filter the rows accordingly.
4. Row-Ownership Patterns
Commonly used in collaborative tools, CRM software, or ticketing systems, this pattern restricts users to rows they personally created or are assigned to. The database tables contain an ownerid or assigneeid column, and the security layer restricts access by matching this field against the authenticated user’s unique ID.
To successfully implement these architectures, you must align your database-level policies with your analytical layer. For databases that support native row-level security, you can define centralized policies directly on your tables. For instance, the Databend documentation outlines how to configure a docs/en/guides/56-security/data-protection/row-access-policy.md at main · databendlabs/databend-docs to filter table rows at query time. For a broader look at multi-tenant structures, read our guide on Multi-Tenant Row Level Security and check out Row-Level Security AWS: A Practical Guide for Multi-Tenant Databases to learn how to scale database-level isolation.
Implementing RLS in Power BI Embedded: Static vs. Dynamic Models
Power BI Embedded is a highly popular choice for SaaS applications, but its security architecture requires careful planning. To build a secure embedded reporting system, you must first design your semantic data model with clear table relationships and establish role-based access control (RBAC) in Power BI Desktop before publishing to the cloud.
Static vs. Dynamic Embedded Analytics Row Level Configurations
When setting up RLS in Power BI, you must choose between static and dynamic security configurations.
Static security relies on fixed DAX filters defined for specific roles. For example, you might create a role named “USSalesRole” with the DAX filter [Country] = “US”. While static security is easy to set up for a handful of large, distinct groups, it quickly becomes an administrative nightmare for multi-tenant SaaS applications. If you have 500 customers, you do not want to manually create and maintain 500 separate roles in Power BI Desktop.
Dynamic security solves this scaling problem by using dynamic DAX expressions. Instead of hardcoding filter values, you use functions like USERNAME() or USERPRINCIPALNAME(). When your web application generates an embed token, it programmatically injects the current user’s unique identifier (such as their tenant ID or email address) as the “username”. The DAX filter then evaluates dynamically at runtime, matching the injected value against your data tables:
[TenantID] = USERNAME()
This single, dynamic DAX rule can scale to support thousands of tenants without any manual role creation. For a simplified, easy-to-understand breakdown of this concept, check out Row Level Security Power BI Explained Like You Are Five or read the official Microsoft documentation on Security in Power BI embedded analytics.
Step-by-Step Guide to App-Owns-Data with Embedded Analytics Row Level Security
For most customer-facing SaaS applications, you will want to use the “app owns data” model. This model allows your external users to view secure, filtered reports without needing their own Power BI licenses or Entra ID (Azure AD) accounts.
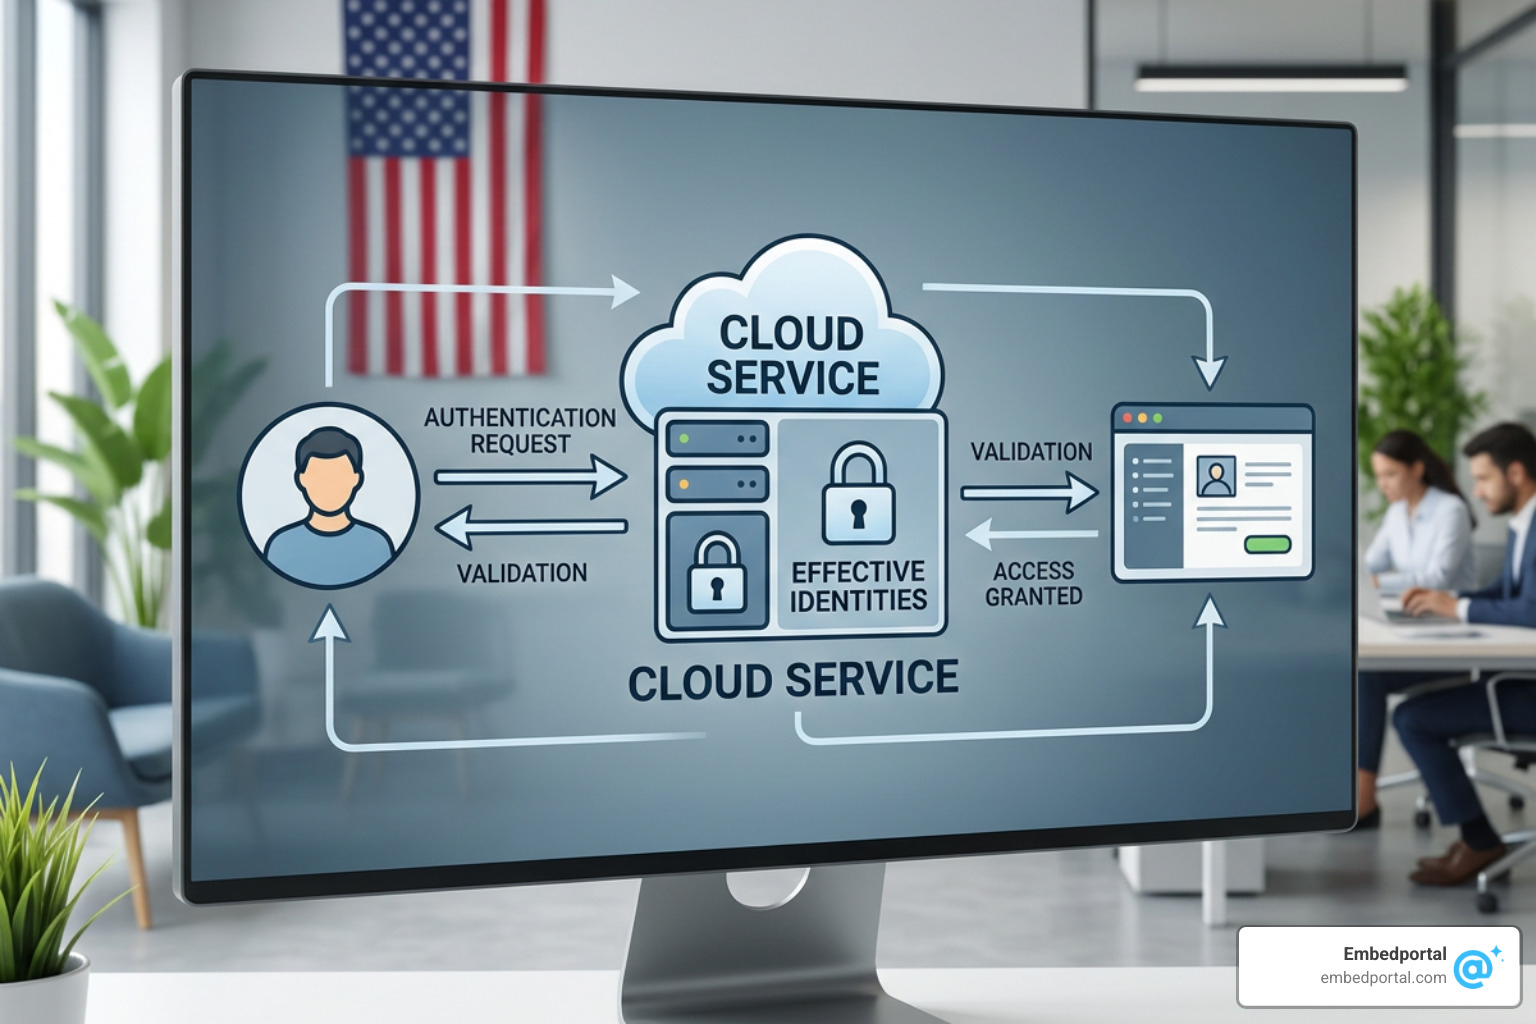
Here is the step-by-step workflow to implement this:
- Design the Model: In Power BI Desktop, go to the Modeling tab, select Manage Roles, and create a dynamic role (e.g., “TenantRole”) using the USERNAME() function on your tenant identifier column.
- Publish to Workspace: Publish your report and dataset to a Power BI workspace that is assigned to a dedicated capacity (A, EM, or P SKU).
- Configure the Service Principal: Set up an App Registration in Azure AD to act as your Service Principal. Add this Service Principal to a security group and enable the “Allow service principals to use Power BI APIs” setting in the Power BI Admin Portal.
- Generate the Access Token: Your backend application authenticates as the Service Principal to obtain an Azure AD access token.
- Call the Effective Identities API: To generate a secure embed token for the user, call the Power BI REST API endpoint (GenerateToken) and pass an “effective identity” payload in the JSON request body.
The JSON payload must include the target username (the tenant ID or email), the role you defined in step 1, and the dataset ID. The payload structure looks like this:
- username: “tenant102id”
- roles: [“TenantRole”]
- datasets: [“your-dataset-uuid-here”]
By passing this identity, Power BI generates a unique, short-lived embed token that strictly restricts the data to “tenant102id”. To implement this programmatically, refer to Row Level Security Power BI and follow the detailed backend developer steps in Implementing Row-Level Security in Power BI Embedded.
Advanced Governance: Compile-Time Authorization vs. BI-Layer RLS
While traditional BI-layer RLS is highly effective, it has architectural trade-offs. Because traditional RLS is evaluated at runtime inside the BI tool, the database connection is typically established using a single, highly privileged service account. The database itself remains blind to the end-user’s identity—a classic “confused deputy” scenario where any agent or external script bypassing the BI layer can access all raw data.
To solve this, advanced data teams are moving toward compile-time governance tools like Colrows.
Unlike runtime BI-layer filtering, compile-time authorization operates within the semantic graph layer before a query is ever executed. When a user requests a dashboard, their identity and attributes are analyzed during the query planning phase. The system evaluates the security policies and compiles the authorized row-level predicates directly into the SQL query AST (Abstract Syntax Tree).
If a user attempts to execute an unauthorized query or access forbidden columns, the compilation fails immediately at the semantic layer. No query is generated, no connection is opened, and the database never reads a single row of data.
Furthermore, compile-time governance provides:
- Deterministic Auditability: Every query carries a point-in-time reproducible audit trace showing the exact policies evaluated, the active user attributes, and the final compiled SQL.
- Improved Performance: By injecting optimized SQL predicates at compile time, the database can leverage native query planners, indexes, and partitions, avoiding the performance overhead of complex runtime joins or post-hoc masking.
- Centralized Control: Security policies are defined as version-controlled code within your semantic layer rather than being scattered across multiple dashboard tools.
To explore how centralized models can simplify your compliance architecture, read our guide on Centralized Row Level Security.
Frequently Asked Questions about Embedded Row-Level Security
How do external users view filtered content without signing into Azure AD?
By using the “App Owns Data” embedding model, your application acts as the single trusted broker. Your backend authenticates with Power BI using a Service Principal (an Azure App Registration). Your end-users never log into Microsoft or Azure AD directly; they simply log into your SaaS application. Your backend verifies their session, determines their tenant ID, programmatically generates an embed token with the appropriate “effective identity” payload, and passes that token to the frontend iframe.
What are the key limitations of using RLS with embed tokens?
When using RLS with Power BI embed tokens, there are several critical limitations to keep in mind:
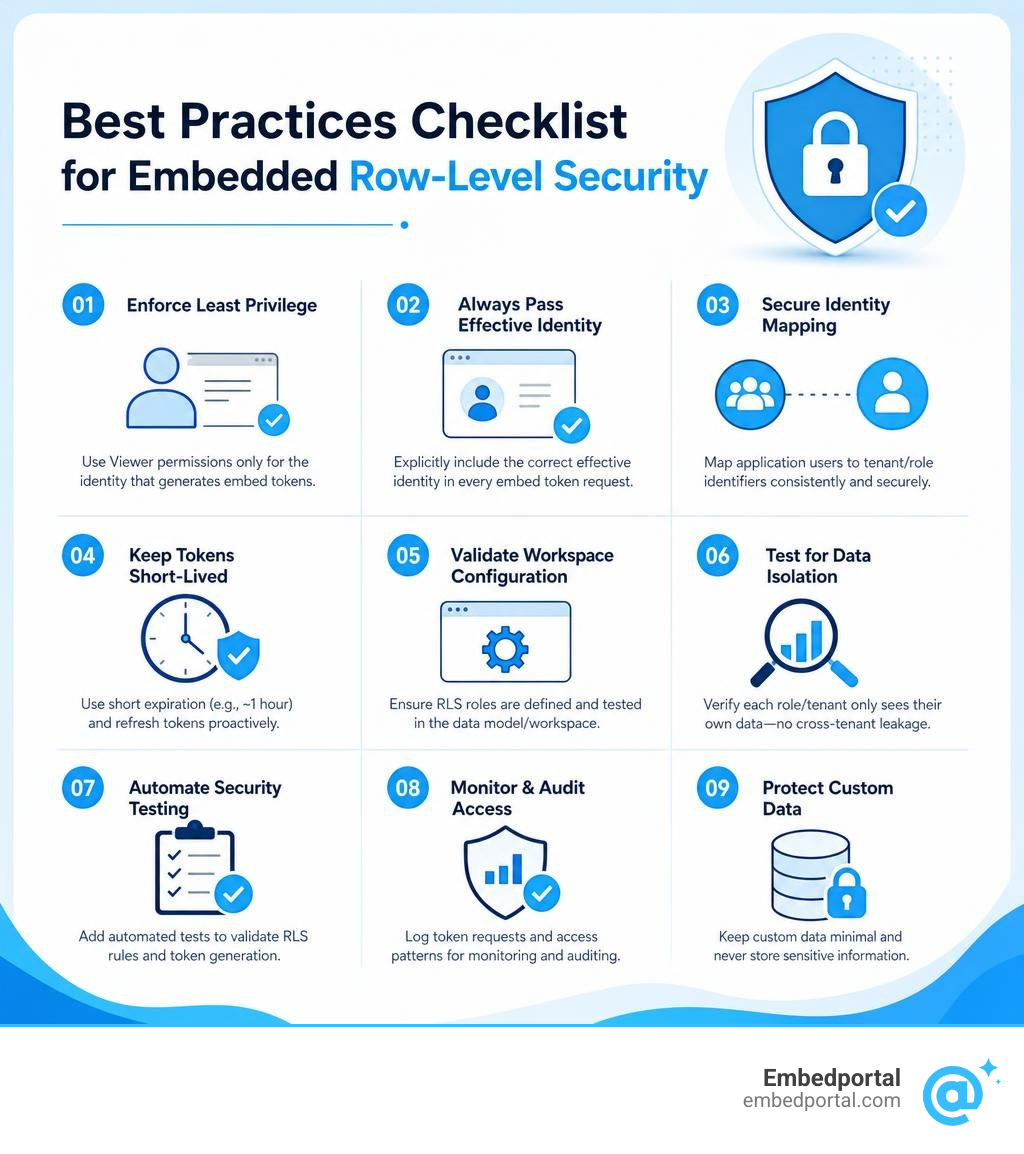
- Workspace Permissions: If the Service Principal or master user generating the embed token is an Admin, Member, or Contributor in the Power BI workspace, RLS will be bypassed, and they will see all data. To enforce RLS, the generating identity must only have “Viewer” permissions on the workspace, or you must explicitly pass the effective identity in the API call.
- Token Expiration: Embed tokens are short-lived (typically expiring in 1 hour) and must be refreshed programmatically by your frontend application to prevent dashboard loading failures.
- Custom Data Limits: If you use the CUSTOMDATA() function instead of USERNAME() to pass custom strings, the string length is limited to 256 characters.
How can organizations test and validate RLS configurations to prevent data leakage?
Data leakage is a catastrophic security failure, meaning testing your security rules is critical. We recommend a three-step validation framework:
- Use “View As” Roles: In Power BI Desktop or your BI tool’s modeling sandbox, use the “View As” or security preset feature to simulate different roles and usernames, verifying that the visual tables update correctly.
- Automate API Testing: Write integration tests in your deployment pipeline that attempt to generate embed tokens with unauthorized tenant IDs, verifying that the API returns the correct restricted payloads or fails securely.
- Inspect the SQL Queries: Enable database query logging in a staging environment. Inspect the actual SQL queries arriving from your BI tool to ensure that the WHERE clauses are being appended correctly and that no unfiltered queries are reaching your warehouse.
For a structured testing checklist, see our A Step-by-Step Guide to Row Level Dashboard Security.
Conclusion
Implementing embedded analytics row level security is the single most important step in protecting sensitive customer data within multi-tenant SaaS applications. While configuring RLS natively inside individual BI tools can be highly complex and difficult to scale, modern solutions make this process seamless.
At Embedportal, we provide a white-label embedding platform designed to eliminate the friction of multi-vendor analytics. Based in California, USA, our platform enables software teams to embed dashboards from Tableau, Power BI, QuickSight, and Metabase with unified branding, robust row-level security, and Single Sign-On (SSO) in under an hour.
Instead of spending weeks writing complex API integrations, managing token lifecycles, and troubleshooting identity propagation for each BI vendor, you can use our unified security layer to handle tenant isolation automatically.
Ready to simplify your embedded analytics architecture? Explore the Embedportal Embedded Analytics Platform today and launch secure, beautifully branded dashboards for your customers in record time.