
Choosing an embedded analytics platform gets messy fast. The demo looks polished, the charts look sharp, and then somebody asks how customer A will see only store 17 while customer B can see every region, and suddenly the real project appears. This guide covers what actually matters when you need customer-facing analytics inside your product, especially if your stack already runs on Tableau, Power BI, or AWS QuickSight and row-level security is the part keeping everyone up late.
Start With the Job You Actually Need the Platform to Do
The best buying decision starts with a simple question: what job is this platform supposed to do inside your product?
If the answer is “show dashboards,” that is too vague to help. What you really need is something more like this: give external users analytics inside your app, make access automatic, keep each account’s data separate, and avoid turning every new customer, role change, or support ticket into a manual permissions cleanup. That is the real job.
This matters because feature lists can be distracting. A vendor can have gorgeous visualizations, a long list of connectors, and a slick admin panel, yet still make your life miserable if every tenant needs custom setup or every access change requires a script. For customer-facing analytics, operational fit beats flashy extras almost every time.
Internal BI and Embedded Analytics Are Not the Same Thing
Internal BI is built for your own teams to explore data, build reports, and answer changing questions. Embedded analytics is different. It puts dashboards, KPIs, and reports inside your product so your customers can use them without feeling like they left your app.
That sounds like a small difference, but it changes almost everything. Internal BI can tolerate a bit of friction. Your finance team can handle a separate login. Your analysts can live with tool-specific navigation. Your customers will not be nearly as forgiving. If the analytics experience feels bolted on, trust drops immediately.
That is why teams using Tableau, Power BI, or AWS QuickSight often hit a wall when moving from internal dashboards to external delivery. The BI layer may already work. The hard part is everything around it: identity, provisioning, tenant isolation, branding, and access control.
Why Row-Level Security Changes the Buying Decision
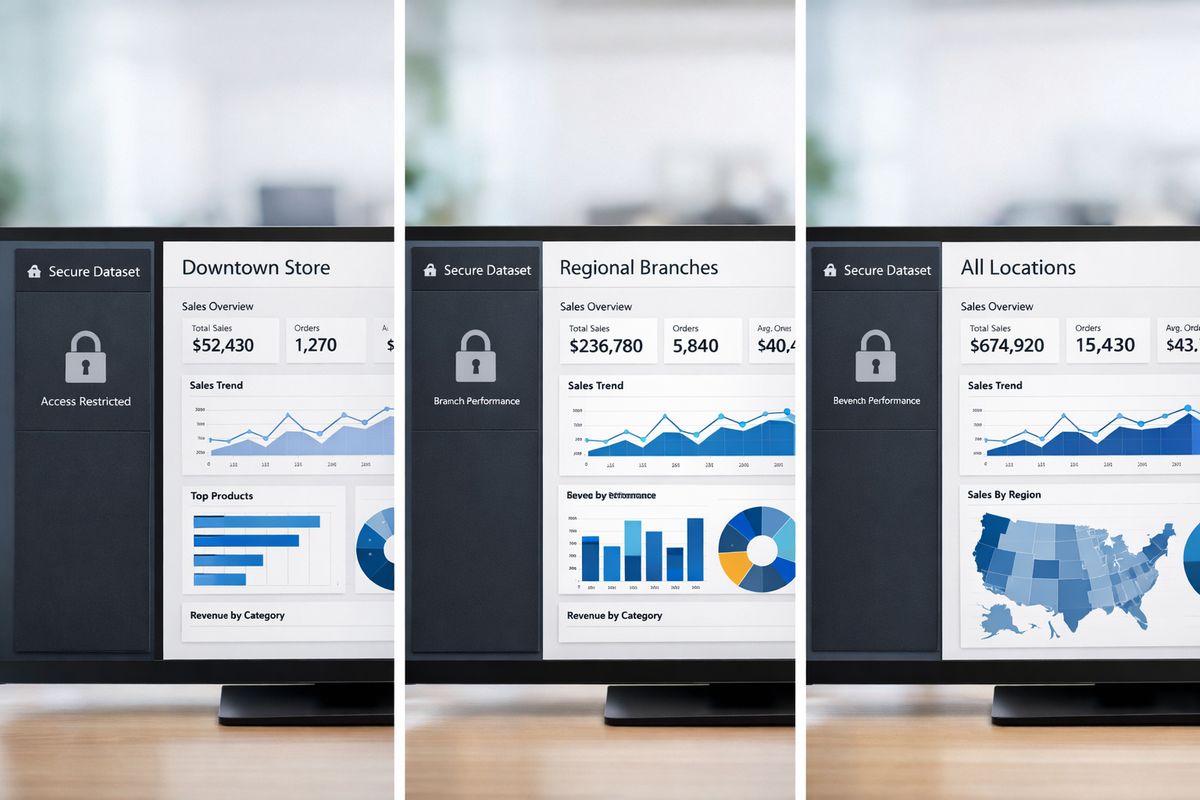
Row-level security means each user sees only the data that matches permission rules. In practice, that could mean one franchise owner sees only one location, a regional manager sees five states, and a finance admin sees an entire account.
For embedded analytics, that is not a nice extra. It is the whole game.
Once multiple customers, roles, or business units are involved, weak RLS turns into a product risk, a security risk, and a support risk all at once. If you want a deeper background before evaluating tools, it helps to review how access rules work inside shared reporting. Buying without getting clear on RLS is a little like buying a front door because the paint looks nice while ignoring whether the lock works.
Know Your Embedded Analytics Options Before You Compare Vendors
A lot of bad evaluations happen because completely different tool categories get compared as if they solve the same problem. Some products are BI tools with embedding features. Some are full embedded analytics platforms. Some are management layers that sit between your app and your BI stack.
You need to know which category you are looking at before you judge it.
Native Embedding From BI Tools
Native embedding means using Tableau, Power BI, or QuickSight directly to place dashboards inside your application. The obvious upside is speed. If dashboards already exist, you can reuse familiar assets, keep existing authoring workflows, and avoid moving your reporting logic to a new system.
That can be a smart path, especially early on. The catch is that native embedding often handles the visible part of the problem better than the operational part. You still have to figure out external user access, identity mapping, tenant separation, and how permissions get created and maintained over time.
In other words, the charts may show up quickly, but the administration behind them can still be rough.
Purpose-Built Embedded Analytics Platforms
Purpose-built embedded analytics platforms are designed specifically for customer-facing use cases. These usually offer stronger product integration, more control over white labeling, and more flexibility around how dashboards, drill-downs, and exploration fit inside your app.
These make sense when embedded analytics is a major product surface, not just an add-on. If you need tight UX control, self-service exploration, custom workflows, or a lot of embedded interactions, a purpose-built platform can save you from fighting a BI tool that was originally designed for internal users.
The trade-off is implementation effort. Depending on your current setup, moving to a dedicated platform may mean rebuilding content, retraining teams, or changing parts of your data workflow.
Middleware and Management Layers
This category is getting more attention for a reason. Middleware and management layers sit between your application and tools like Tableau, Power BI, or QuickSight. Instead of replacing the BI stack, these tools simplify provisioning, access control, user lifecycle management, and embed workflows.
This approach is often the practical choice when dashboards already exist and the real pain is operational. If your main issue is not “how do you build a chart?” but “how do you safely manage hundreds or thousands of external users without constant manual work?” this category deserves a close look.
Security and Access Control Should Be the First Filter
Security should be your first filter, not the thing you get around to after comparing themes and chart types. In customer-facing analytics, security architecture decides whether the rollout is clean or chaotic.
A polished demo can hide a lot of manual work. What you want to know is simple: how does access get granted, changed, and revoked in the real world?
Row-Level Security That Works the Way Your Product Works
Good RLS should match your business model without forcing awkward workarounds. If your product serves tenants, customer accounts, regions, franchises, departments, or custom user roles, your analytics platform should support those patterns directly.
Do not settle for abstract answers here. Ask to see actual scenarios. A shared dashboard used across many customers is common, but the rules behind it need to stay precise. If your team is trying to avoid cloning content for every account, it is worth understanding how to keep one dashboard while separating each tenant’s data.
The trick is to test messy reality, not the clean sample data from a demo. Move a user from one account to another. Give somebody two roles. Limit a manager to one region for one dashboard and three regions for another. That is where you learn whether the platform really fits.
User Provisioning and Deprovisioning
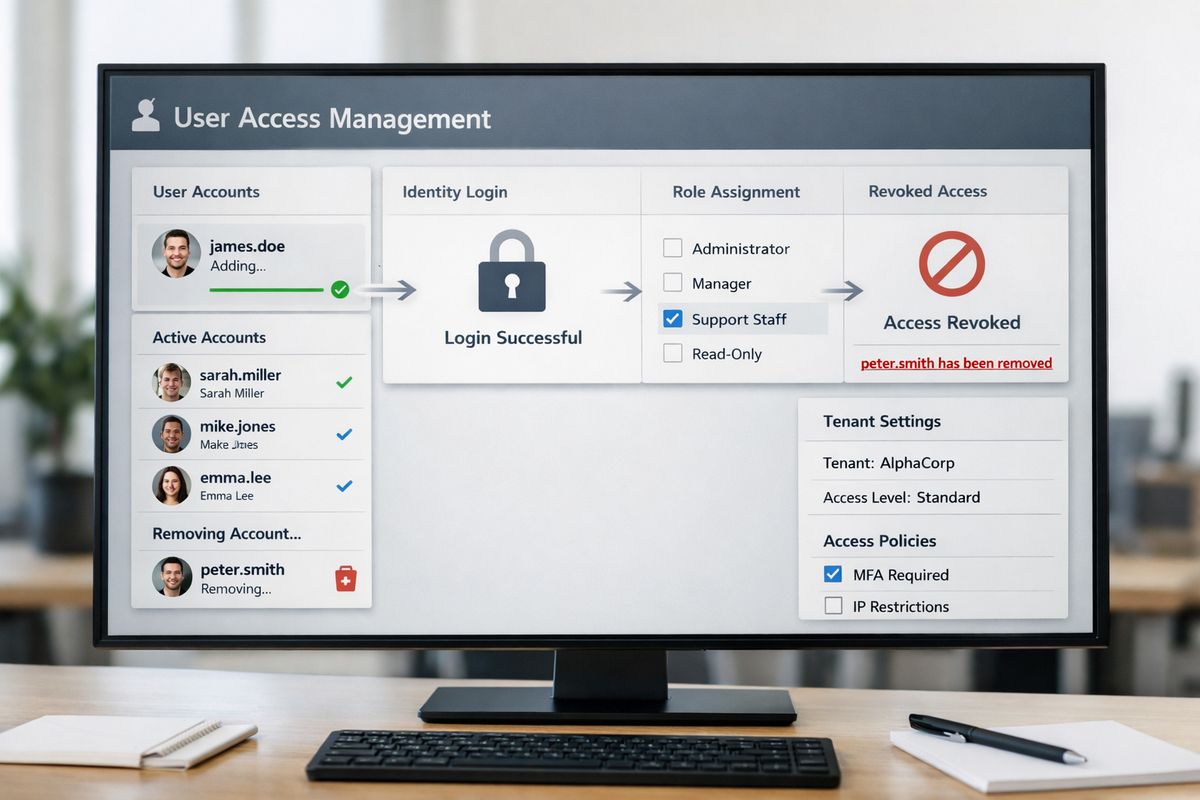
Provisioning is how users get access. Deprovisioning is how access gets removed. Both sound boring until you are doing them every week.
Look for support for SSO, SCIM, just-in-time provisioning, and APIs that let your product drive access changes automatically. Manual invites and spreadsheet-driven role changes may work for a pilot, but they get painful quickly once customer count grows.
Here’s the thing: the wrong setup creates invisible costs. Product gets blocked waiting for updates. Support gets dragged into access tickets. Engineering writes one-off scripts. Security worries about stale accounts that should have been removed weeks ago.
Multi-Tenant Isolation
“Multi-tenant” gets used loosely, so push for specifics. Does the platform isolate customers through separate tenants, namespaces, workspaces, datasets, policies, or some combination? What is shared, and what is isolated?
Some setups create one customer per tenant. That can feel clean, but it may create admin sprawl. Others use shared infrastructure with policy-based separation. That can scale better, but only if the permission model is clear and reliable.
The right choice depends on your product and customer base. What matters is understanding how isolation works for dashboards, data, users, and admin boundaries before launch, not after.
Audit Trails and Compliance Needs
If customer data is involved, auditability stops being a nice admin feature and becomes part of the sales and security conversation. Enterprise buyers will ask who accessed what, when permissions changed, and whether exports or shares can be tracked.
You should look for usable logs, not just technical noise. Can you trace access changes? Can support verify what happened during a customer complaint? Can your security team answer review questions without pulling raw system events apart for half a day?
That history matters during investigations, renewals, and internal reviews. It also saves time when somebody swears a user “saw the wrong dashboard” and you need facts, not guesses.
Make Sure Embedding Feels Native Inside Your Product
Customers do not care which analytics engine is behind the scenes. Your app owns the experience either way. If the embedded layer feels clunky, that clunkiness belongs to your product in your customer’s mind.
Authentication and Seamless Login
Nothing kills adoption faster than a second login prompt inside a page that was supposed to feel native. Authentication should be smooth, predictable, and invisible when possible.
Look closely at embedded SSO, token-based access, session behavior, and how identity gets passed from your app into the analytics layer. If a user signs into your product and then hits a BI login page, you already lost some trust.
This is also where security and UX meet. Smooth login cannot come at the cost of loose session handling or fragile token flows. You want both.
UI Customization and White Labeling
A lot of platforms say “white labeling” when they really mean “you can upload a logo.” That is not enough for a polished product experience.
You want control over navigation, embedded chrome, colors, spacing, iframe behavior, and the ability to hide vendor-specific clutter. Even small things matter here. A random toolbar button that leads users outside your app or exposes the wrong workflow can create confusion fast.
The goal is simple: analytics should feel like a natural part of your product, not a tenant from another building using the same hallway.
Responsiveness and Performance in Real User Conditions
Performance needs to be tested where customers actually live, not just on perfect office internet. A dashboard that feels fine on a fast connection can drag badly in ordinary use.
Picture a customer review in a hotel conference room in Chicago. The Wi-Fi is spotty, filters take five seconds to respond, and the dashboard stutters on mobile. That is still your product experience. Your customer is not separating “the app” from “the BI layer” in that moment.
Test page load times, filter speed, mobile behavior, and how quickly dashboards recover after context changes. Performance is not cosmetic. It changes whether analytics gets used or ignored.
Check the Data Model and Integration Fit Early
Some evaluations feel easy in week one because the demo starts at the dashboard layer. The expensive part shows up later, once you realize the platform expects a different identity model, a different data structure, or a bunch of custom glue code.
Compatibility With Tableau, Power BI, and AWS QuickSight
Tableau, Power BI, and QuickSight can all be embedded, but they behave differently around identity, permissions, asset structure, and administration. That matters more than many vendor comparisons admit.
If your organization already depends on one of these tools, prioritize platforms that complement what you already have. A rip-and-replace may sound clean in theory, but it usually adds cost and delays unless your current setup is truly broken.
For access-heavy deployments, it helps to understand how teams handle outside users without loosening security controls. That question often matters more than the embedded iframe itself.
Data Source Flexibility and Refresh Options
Ask how the platform handles live queries, extracts, cached models, and scheduled refreshes. Customer expectations around freshness vary a lot. An operations dashboard may need near-real-time updates. A monthly finance view may not.
The wrong refresh model creates tension fast. Live queries can strain infrastructure. Heavy extracts can go stale. Caching can improve performance but complicate expectations if users think they are seeing current numbers.
Choose based on your product’s promise, not on whatever default setting looks easiest in a demo.
API and Developer Workflow
Developer experience matters because this is not a one-time setup. Your team will maintain it, extend it, automate it, and debug it later.
Look at APIs, SDKs, embedding docs, authentication examples, admin automation hooks, and how easy it is to manage environments programmatically. Good documentation saves real time. Clear APIs reduce the need for brittle workarounds. A decent dev workflow also makes handoffs between product, engineering, and data much less painful.
Compare Governance, Administration, and Day-Two Operations
Launch day gets the attention. Day two is where the pain starts if governance is weak.
Once real customers are using embedded analytics, somebody has to manage users, permissions, content updates, environment changes, and support requests without breaking access. That is the actual long-term job.
Centralized User and Group Management
At small scale, manual user setup feels tolerable. At larger scale, it becomes a drain.
Look for centralized administration across customers, roles, and environments. You want one place to see who has access, how groups map to permissions, and what changed recently. If access management is scattered across your app, your BI tool, and custom scripts, mistakes become almost guaranteed.
This gets especially painful when a handful of pilot accounts turns into hundreds. At that point, keeping access organized across analytics users stops being an admin preference and starts being basic survival.
Permission Templates and Reusable Policies
Reusable permission models save time and prevent errors. Role templates, group-based rules, and inherited policies are much safer than one-off manual grants.
If every new customer account requires custom setup, your process will not scale. If every exception creates another special case, your support burden will keep rising.
The better model is predictable. Sales adds a new customer type, product defines the access pattern, and administration applies an existing rule set with minor adjustments. Less improvisation, fewer mistakes.
Environment Management for Dev, Test, and Prod
Your analytics setup needs to move safely across development, testing, and production. That includes dashboards, permissions, configuration, and identity behavior.
This matters because embedded analytics usually touches multiple teams. Product cares about experience, engineering cares about integration, and data cares about content and correctness. Without solid environment management, small changes become risky and releases slow down.
Ask how content and access rules get promoted across environments. If the answer is copy-and-hope, expect trouble later.
Look Beyond Dashboards to Product and Customer Experience
A buyer’s guide should not stop at “can it show charts?” Customers expect more than static reporting, especially once analytics becomes part of the product story.
Self-Service Exploration vs Fixed Reporting
Some products need fixed dashboards with locked views. Others need filters, drill-downs, and light exploration. A smaller set needs deeper ad hoc analysis.
Be honest about what your customers actually need. More flexibility sounds attractive, but it adds governance complexity and support overhead. If most users just want a clean KPI page and export options, do not overbuy for analyst-style exploration. But if customers regularly ask follow-up questions that fixed reports cannot answer, overly rigid analytics will frustrate them.
Alerts, Exports, and Sharing Controls
These features often get treated as small extras. They are not. Once customers rely on analytics, somebody will ask for scheduled reports, CSV exports, PDFs for leadership meetings, and controlled sharing.
The catch is that these features also introduce risk. Exports can bypass in-app guardrails. Shared links can create access confusion. Scheduled reports can expose stale or overly broad data if permissions are not tight.
Look at how alerts, exports, and sharing interact with your access model, not just whether the checkbox exists.
Usage Analytics and Adoption Tracking
If you cannot see who uses dashboards, how often, and where drop-off happens, you are guessing. Usage data helps product teams improve analytics, helps customer success drive adoption, and helps leadership justify the investment.
This is especially useful after launch, when assumptions meet reality. The dashboard your team thought would be the star may get ignored, while one simple report becomes the thing customers open every Monday morning.
Budget for the Full Cost, Not Just the License
Licensing matters, but license cost alone tells you very little about the real price of embedded analytics.
The expensive part often shows up in implementation time, admin overhead, security work, and the cost of fixing a setup that never fit your operating model.
Licensing Models and Scaling Triggers
Pricing can be based on named users, sessions, capacity, usage, or a platform fee. Embedded scenarios get tricky because external users can scale fast.
A model that looks cheap at 50 users may feel very different at 5,000. Session-based pricing can be attractive until usage spikes. Per-user pricing can get painful in broad customer deployments. Capacity pricing may work well if usage is steady and predictable.
The important part is knowing what triggers cost growth before you sign.
Implementation and Maintenance Costs
Ask what the project will take to implement, not just what the software costs. Identity integration, dashboard migration, RLS setup, provisioning automation, support workflows, and admin training all add real effort.
The cheapest license can become the most expensive setup if your team has to build missing pieces from scratch. That is especially true when security, user lifecycle management, and white labeling need custom work.
When Paying More Actually Saves Time
Sometimes a higher-priced platform is the cheaper decision because it removes months of engineering work and years of admin cleanup. That is not vendor hype. It is just math.
If a tool simplifies provisioning, enforces RLS cleanly, and reduces the need for custom scripts and repetitive admin work, the value shows up quickly. Teams often underestimate how much time ongoing access management eats once external analytics goes live.
Common Mistakes That Make Embedded Analytics Harder Than It Needs to Be
Most embedded analytics problems are not caused by charts. They come from underestimating access control, admin workflow, and the differences between internal reporting and customer-facing delivery.
Choosing Based on Demo Visuals Instead of Access Control
A pretty dashboard can hide a weak operational model. Demos are designed to show the best five minutes, not the fiftieth customer onboarding or the awkward role exception you discover during rollout.
Access control, provisioning, and tenancy decide whether your implementation stays manageable. Start there.
Treating RLS as a Later Configuration Step
RLS should shape the project from day one. It affects your data model, identity flow, admin design, and testing plan.
If you treat it like a final config task, you usually end up reworking dashboards, permission mappings, or provisioning logic later. That is avoidable. For a more practical angle, it helps to review the access patterns that hold up best for outside-facing reporting.
Ignoring Admin Workflow Until Customer Count Grows
Manual setup feels fine when you have three accounts and one helpful engineer. It feels terrible when customer number 75 needs a role change before a Friday renewal call.
Build with growth in mind. Automation does not need to be perfect on day one, but your platform should make it possible.
Underestimating the Differences Between Tableau, Power BI, and QuickSight Embedding
These ecosystems are not interchangeable. Each has different patterns for identity, asset organization, embedding, and external access.
Do not assume that a workflow that worked in Tableau will transfer cleanly to Power BI or QuickSight. Validate specifics for the stack you actually run.
Match the Right Platform to Your Use Case
The right choice depends less on generic rankings and more on where your current friction lives.
If You Already Run on Tableau
Prioritize governance fit, external sharing controls, user sync, and RLS enforcement that does not require constant dashboard duplication. If Tableau content already powers your internal analytics, a management layer that simplifies external access may be more useful than a brand-new analytics stack.
If You Already Run on Power BI
Look closely at the embedding model, workspace structure, identity flow, and how external user permissions are managed. Power BI can work well for customer-facing analytics, but the operational details matter a lot once users live outside your organization.
If You Already Run on AWS QuickSight
Focus on identity integration, tenancy design, namespace strategy, scaling behavior, and how much custom plumbing is needed for customer access. QuickSight can be a strong fit in AWS-heavy environments, but you still need a clean plan for user lifecycle and access boundaries.
If Your Main Pain Is User Management and RLS
If dashboards already exist and the real blocker is access orchestration, look closely at platforms that sit on top of your current BI tools and simplify the hard part. That path often gets you to value faster because you are fixing operations instead of rebuilding reporting from scratch.
Use a Short Evaluation Checklist Before You Commit
By the time you are in demos and pilots, you need a short decision framework. Not a giant spreadsheet. Just a clear way to test what matters.
Questions to Ask in a Demo
Ask to see how RLS is configured for real customer roles. Ask how tenant isolation works. Ask how users are provisioned, moved, and removed. Ask what white labeling actually includes. Ask what gets logged. Ask how Tableau, Power BI, or QuickSight are supported in practice.
Most importantly, ask for workflows, not slides. Watching somebody revoke a user’s access is more useful than hearing “enterprise-grade security” for the sixth time.
Tests to Run in a Pilot
Run a pilot with real scenarios from your product. Create users with different customer roles. Revoke access and confirm it disappears quickly. Move a user between accounts. Test dashboard load times under ordinary network conditions. Check what admins have to do to support common requests.
A one-week pilot with realistic workflows will tell you more than a month of polished presentations.
Try the Simplest Fix for the Hardest Part
If your biggest headache is not building dashboards but managing users, provisioning access, and enforcing RLS across Tableau, Power BI, or AWS QuickSight, start there. That is usually the bottleneck that slows everything else down.
Try embedportal.com this week if you want a simpler way to handle user management and row-level security without rebuilding your analytics stack. It is a practical way to clean up provisioning, access control, and customer-facing embedding so your team can spend less time chasing permissions and more time shipping a product experience that actually feels finished.
Frequently Asked Questions
What is an embedded analytics platform?
An embedded analytics platform puts dashboards, reports, and data experiences inside your product so customers can use analytics without leaving your app. The platform may handle visualization, embedding, access control, or all three.
How is embedded analytics different from internal BI?
Internal BI is meant for your own teams to explore data and answer internal questions. Embedded analytics is designed for external users, which means login flow, branding, permissions, and tenant isolation matter much more.
Why is row-level security so important for customer-facing analytics?
Row-level security makes sure each user sees only the records allowed for that account, role, or region. In customer-facing analytics, that is the foundation of trust. Without it, shared dashboards become risky very quickly.
Should you replace Tableau, Power BI, or QuickSight to improve embedded analytics?
Not always. If your dashboards already work well, replacing the BI layer may create more work than value. In many cases, the better move is adding a platform or management layer that fixes user access, provisioning, and RLS around your existing tools.
What should you test first during an evaluation?
Test real access workflows first. Create users, assign roles, change permissions, revoke access, and verify tenant isolation. If those workflows are clumsy in a pilot, the setup usually gets worse at scale.
What drives the real cost of an embedded analytics platform?
The biggest costs usually come from implementation time, identity integration, security setup, admin overhead, and maintenance. License price matters, but operational complexity often matters more.