The Challenges of Multi Vendor Reporting and How to Solve Them
Why Multi-Vendor Analytics Is Harder Than It Looks (And How to Fix It)
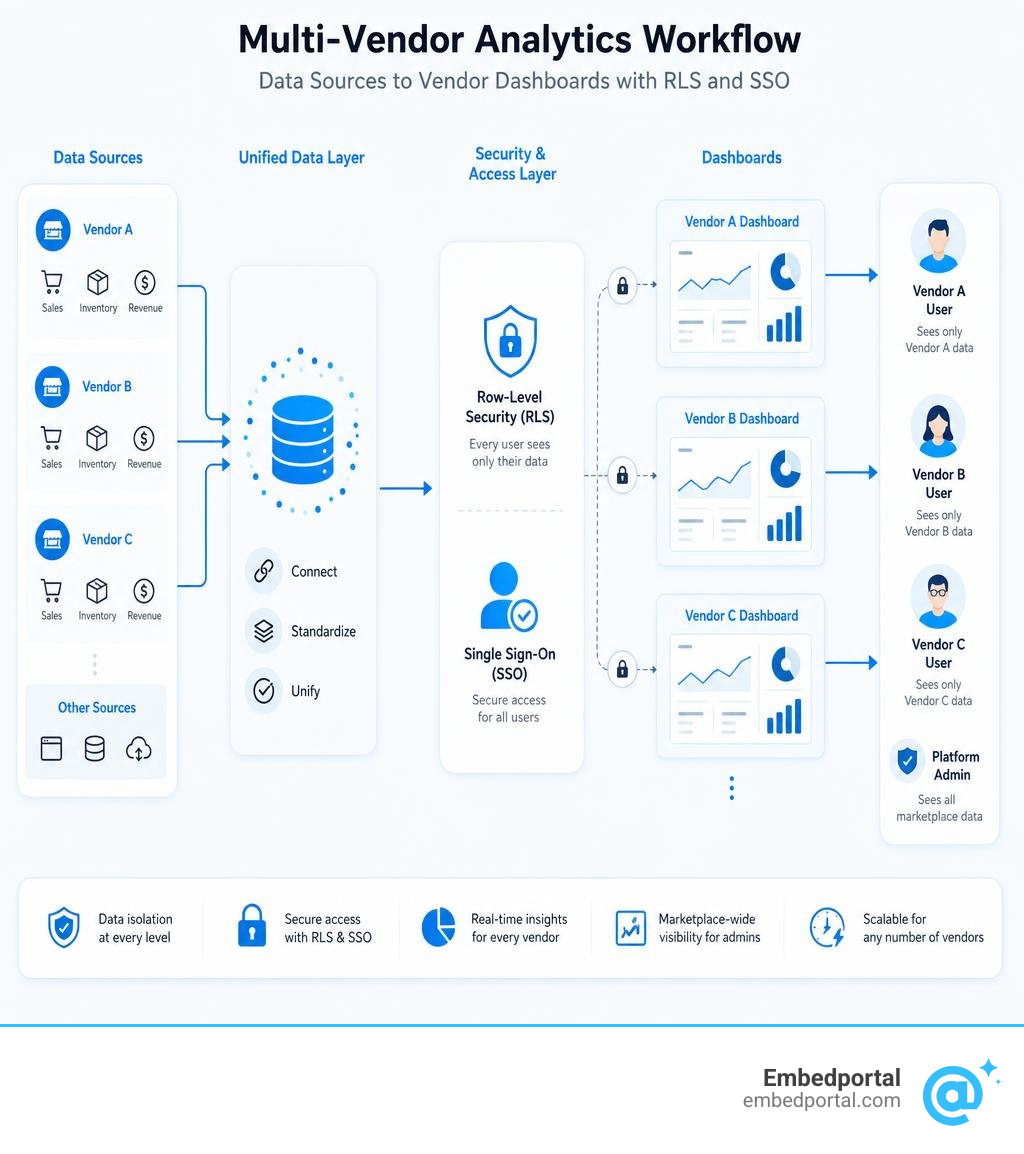
Multi-vendor analytics is the practice of collecting, unifying, and analyzing performance data across multiple independent sellers or data sources within a shared platform — giving both marketplace operators and individual vendors the insights they need to make better decisions.
Quick answer — what multi-vendor analytics covers:
- Data unification — pulling sales, inventory, and revenue data from multiple vendor sources into one view
- Vendor-level reporting — giving each vendor access to their own data without exposing other vendors’ data
- Marketplace-wide KPIs — tracking Gross Merchandise Value (GMV), Average Order Value (AOV), seller churn, and customer retention across the whole platform
- Access control — enforcing row-level security so every user only sees what they’re permitted to see
- Embedded dashboards — surfacing analytics inside your product or portal with consistent branding and authentication
Here’s the uncomfortable truth: most teams underestimate how hard this gets at scale.
A single-vendor dashboard is straightforward. You have one data source, one set of users, one brand. But the moment you add multiple vendors — each with their own catalog, performance profile, and data privacy expectations — the complexity compounds fast.
Consider a platform with 200 vendors. Each vendor wants to see their page views, their revenue, their top products. They don’t want to see anyone else’s data. And the platform operator needs a bird’s-eye view across all of them. That’s not one reporting problem — it’s hundreds of them, running simultaneously, inside a single system.
The stakes are real. Platforms with strong multi-vendor analytics see inventory turnover improve by 23% and customer acquisition costs drop by 18%. Elite marketplaces maintain GMV retention of 100% or higher in their first 12 months. The gap between those platforms and the ones struggling? It usually comes down to which numbers they track — and whether vendors can actually access their own data without friction.
For analytics and product leads building embedded reporting into a customer-facing portal, three pain points come up again and again:
- Fragmented row-level security — different BI tools enforce data isolation differently, and stitching them together is error-prone
- Inconsistent branding and auth — dashboards from Tableau, Power BI, or Metabase each look and behave differently inside your product
- Slow custom embedding work — every new vendor or data source means more engineering time
This guide walks through all of it — the challenges, the KPIs that matter, how to manage data access properly, and how modern architectures (including embedded BI platforms) make this tractable.
Understanding Multi Vendor Analytics: Single-Vendor vs. Multi-Vendor Paradigms
To build a reporting system that actually scales, we have to look at how different this is from traditional single-vendor setups.
In a traditional single-vendor environment, the brand owns the entire inventory, manages fulfillment directly, and holds all customer data. The analytics pipeline is linear: pull data from one ERP, one e-commerce platform, and a few advertising channels, then spit out a dashboard.

In contrast, a multi-vendor marketplace functions as a complex, living business ecosystem. Marketplace operators do not carry the inventory risk; instead, they shift fulfillment and product catalog management to third-party sellers. This structural shift means the data pipeline is no longer linear—it is multi-directional and highly fragmented.
For marketplace operators, the goal is to monitor overall ecosystem growth and health. For individual sellers, the goal is to track their own SKU-level margins, advertising efficiency, and delivery performance.
This creates a dual-layer reporting requirement that we call multi-tenant analytics. The operator needs a macro-level dashboard to manage commissions, spot catalog gaps, and optimize order routing. Meanwhile, each vendor requires a micro-level dashboard to run their daily operations. To make this work, many platforms rely on specialized Multivendor Marketplace Platform | Vendor Software to handle core commerce processes, but they still struggle to deliver deep, unified BI directly to those sellers.
The multi-vendor support services market is booming—valued at $57.22 billion in 2025, it is projected to reach $70.83 billion by 2031. This growth is driven by the sheer profitability of the model: platforms with strong multi-vendor support typically experience a 20-30% increase in sales simply due to expanded product variety and the natural competition that arises between vendors. However, capturing this growth requires moving past surface-level vanity metrics.
Key Challenges in Implementing Multi-Vendor Reporting
Building a robust multi vendor analytics stack is notoriously difficult because you are essentially managing an enterprise-grade data warehouse for hundreds of external partners. In our experience working with engineering teams across California and beyond, three main challenges crop up:
1. Hardened Data Silos
Every vendor has their own way of organizing data. One seller might track inventory via NetSuite, another through Shopify, and a third via manual flat files. Unifying these disparate schemas into a single, clean database requires extensive ETL (Extract, Transform, Load) mapping. If your ingestion pipeline cannot translate these formats in real-time, your marketplace dashboard will show conflicting numbers, eroding trust with your partners.
2. Tool Sprawl and High Maintenance Costs
As a platform grows, different teams start adopting different visualization tools. The marketing team wants Looker, finance wants Power BI, and product wants Metabase. When you try to share these dashboards with external vendors, you face a nightmare of tool sprawl. IT cannot easily support multiple BI platforms for external use cases, leading to bottlenecks, broken iframe embeds, and astronomical licensing costs.
3. Complex Data Governance
When you have hundreds of independent businesses operating on your platform, security is not just a feature—it is a legal and commercial necessity. A single data leak showing Seller A’s margins to Seller B could ruin your marketplace’s reputation overnight. Managing this requires strict adherence to row-level security best practices to ensure complete tenant isolation across every shared dashboard.
Critical KPIs and Metrics for Multi-Vendor Marketplace Success
To run a successful marketplace, operators and vendors must align on the metrics that actually drive profitability. Relying on basic revenue figures is a recipe for failure; instead, you need to track operational health and contribution margins.
Here is a breakdown of the critical KPIs that both operators and sellers should monitor:
| KPI Category | Metric Name | Who Tracks It? | Why It Matters |
|---|---|---|---|
| Growth & Volume | Gross Merchandise Value (GMV) | Operator & Seller | Measures the total dollar value of goods sold. Elite marketplaces maintain a GMV retention rate of 100%+ in their first 12 months. |
| Transaction Value | Average Order Value (AOV) | Operator & Seller | Platforms implementing proper multi-vendor strategies see AOV increases of 15-30% due to cross-vendor bundling. |
| Platform Health | Seller Churn Rate | Operator | Calculated as (Sellers Lost ÷ Total Sellers at Start) × 100. High churn indicates poor vendor support or low profitability. |
| Customer Loyalty | Customer Retention Rate | Operator | Rates above 60% signal strong marketplace success; rates under 40% indicate immediate room for improvement. |
| Financial Health | Net Profit Margin | Seller | Combines revenue with advertising spend, COGS, marketplace fees, and shipping costs to show true SKU profitability. |
| Operational Efficiency | Return & Refund Rates | Operator & Seller | Optimal return rates should sit between 5-10%, with refund rates capped at 2-5% to protect margins. |
For sellers managing multiple storefronts outside of your core marketplace, tools like Multi Channel Sales Tracking – Crazy Vendor show how critical it is to factor in hidden costs—like FBA fees, local taxes, and dynamic currency conversions—to understand true net margins. When operators expose these same deep financial insights to vendors within their own portal, vendor satisfaction and retention skyrocket.
Managing Data Access, Privacy, and Permissions Across Multiple Vendors
How do you give 200 different vendors access to the exact same dashboard template while ensuring they can only see their own data? This is the core challenge of multi-tenant data architecture. You cannot build 200 separate dashboards; you must build one dashboard that dynamically filters data based on who is logged in.
Implementing Row-Level Security in Multi Vendor Analytics
The most secure and scalable way to handle tenant isolation is through Row-Level Security (RLS). Instead of filtering data at the application layer (which is highly vulnerable to injection attacks), RLS applies security filters directly at the database or BI tool level.
When a vendor logs into your marketplace portal, their unique session token or vendor ID is passed directly to the database query. The database then only returns the rows where the vendor_id matches the user’s ID.
Implementing multi-tenant row-level security ensures that even if a vendor tries to manipulate the frontend code, they can never query or view another seller’s financial data. It provides absolute, hardened isolation out of the box.
Single Sign-On (SSO) and User Management for External Partners
Your vendors do not want to log into your portal and then log into a separate BI tool to see their reports. The entire analytics experience must feel native, seamless, and white-labeled.
This requires robust Single Sign-On (SSO) integration. When a user authenticates into your marketplace, your app should automatically generate a secure token that authenticates them within the embedded BI frame.
By utilizing standardized user management for BI, you can map roles and permissions dynamically. For instance, you can grant a vendor’s accountant read-only access to financial reports while giving their operations lead full access to inventory and shipping dashboards, all without writing complex custom authentication middleware.
Modern Architectures and Tools for Optimizing Multi-Vendor Operations
As we look toward the future of digital commerce in 2026, the way marketplaces are built is changing. Traditional, monolithic platforms are being replaced by highly composable, modern architectures that make analytics much easier to integrate.
Headless, API-First, and No-Code Impacts on Multi Vendor Analytics
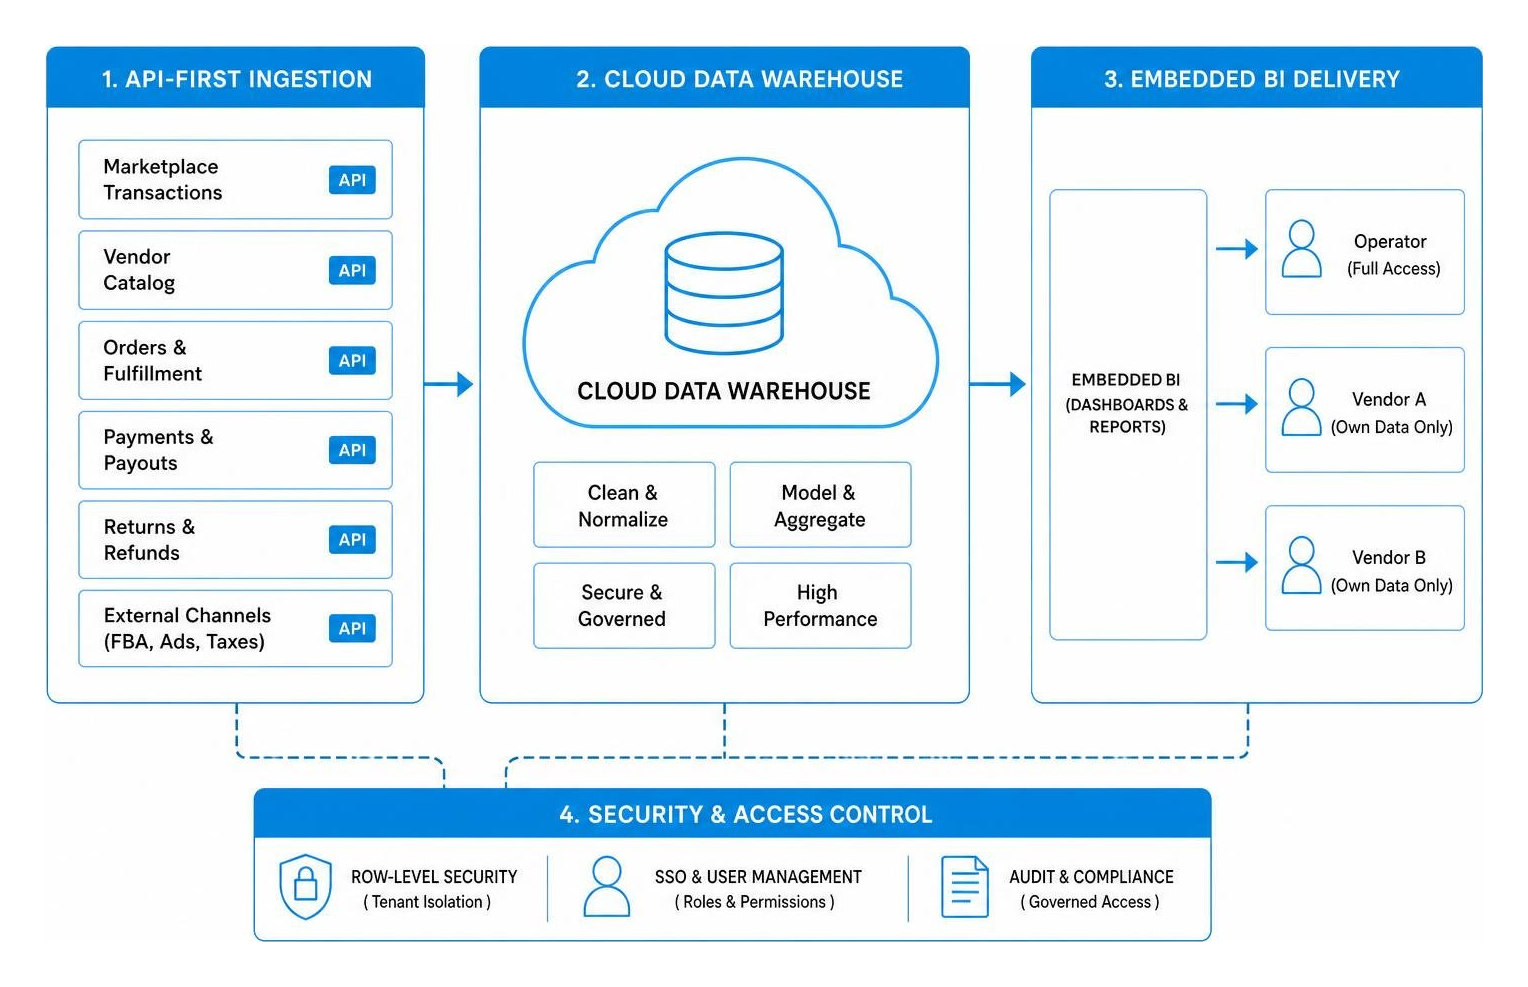
The rise of headless commerce and API-first architectures means that transactional data is no longer trapped inside a rigid e-commerce engine. Instead, data flows freely through lightweight APIs into centralized cloud data warehouses like Snowflake or BigQuery.
This shift has democratized data access. Even non-technical operators can now use no-code and low-code tools to spin up marketplace ecosystems quickly. However, to extract actual value from these API-first setups, you need a robust embedded data analytics strategy.
For instance, platforms like IntelAI Analytics – Seamless Marketplace & ERP Integrations demonstrate how connecting live marketplace channels directly to ERPs and BI pipelines can reduce manual financial reconciliation work by up to 80% and speed up month-end closes from weeks to just three days.
Choosing the Right Embedded BI Solution for Your Scale
When it comes to delivering these insights to your users, you have two choices: build a custom charting solution from scratch, or use an embedded BI platform.
Building from scratch with libraries like D3.js or Chart.js seems appealing at first, but it quickly becomes a maintenance nightmare when vendors start asking for custom date ranges, CSV exports, and scheduled email reports.
Choosing a dedicated embedded analytics platforms allows you to build your reports in professional BI tools like Tableau, Power BI, QuickSight, or Metabase, and then embed them directly into your application. This gives your vendors enterprise-grade reporting capabilities—such as interactive filtering and scheduled alerts—without requiring your engineering team to reinvent the wheel.
Frequently Asked Questions about Multi-Vendor Reporting
How do you secure vendor data in a shared dashboard?
Securing vendor data requires a combination of Row-Level Security (RLS) at the database level and secure token exchange via Single Sign-On (SSO) on the frontend.
When a user requests a dashboard, your application generates a signed token containing the user’s vendor_id. This token is passed to the embedded BI iframe. The BI engine uses this parameter to filter the data source before rendering the charts, preventing any unauthorized shared dashboard access or cross-tenant data leaks.
What is the difference between sourcing view and manufacturing view in vendor analytics?
This distinction is highly critical for large-scale enterprise brand analytics (such as those managing complex supply chains on major retail networks):
- Sourcing View: Filters and displays metrics strictly for products that are sourced directly from the vendor. It focuses on direct purchase orders, fulfillment rates, and immediate supplier lead times.
- Manufacturing View: Displays metrics for all ASINs or SKUs manufactured by the brand, regardless of who sourced or sold them. This view is broader, pulling in traffic, forecasting, and customer feedback metrics that are essential for long-term brand management.
For a complete breakdown of how these schemas behave, refer to the technical Vendor Analytics Dataset Use Case Guide.
How does multi-vendor analytics improve inventory turnover?
Proper tracking systems improve inventory turnover by 23% on average. By aggregating real-time sales velocity, return patterns, and seasonal demand trends across all sellers, multi-vendor analytics allows operators to generate highly accurate demand forecasting models.
Vendors can see exactly which SKUs are at risk of becoming dead stock and which ones need immediate replenishment, preventing costly stockouts and minimizing capital tied up in warehouses.
Conclusion
Building a successful multi-vendor marketplace is an exercise in ecosystem enablement. When you give your vendors clear, secure, and actionable data, you don’t just help them run their businesses better—you drive the natural competition and product variety that increases your platform’s overall sales by 20-30%.
But you shouldn’t have to spend months of engineering time building custom authentication, setting up complex row-level security rules, or wrestling with inconsistent branding across different BI tools.
At Embedportal, we help SaaS teams and marketplace operators embed professional BI dashboards (from Power BI and Tableau to QuickSight and Metabase) directly into their portals in under an hour. With our white-label embedding platform, you get unified branding, hardened row-level security, and seamless SSO integration out of the box—giving your vendors the enterprise-grade analytics they expect without the development headache.
Ready to see how simple multi-tenant reporting can be? Learn more about our embedded BI solutions and take control of your marketplace data today.