The Developer’s Guide to White Label Embedded Analytics Integration
Why Every SaaS Product Team Is Talking About White Label Embedded Analytics
White label embedded analytics is the practice of integrating a fully branded analytics experience directly into your product — so your customers never see any trace of the underlying BI vendor.
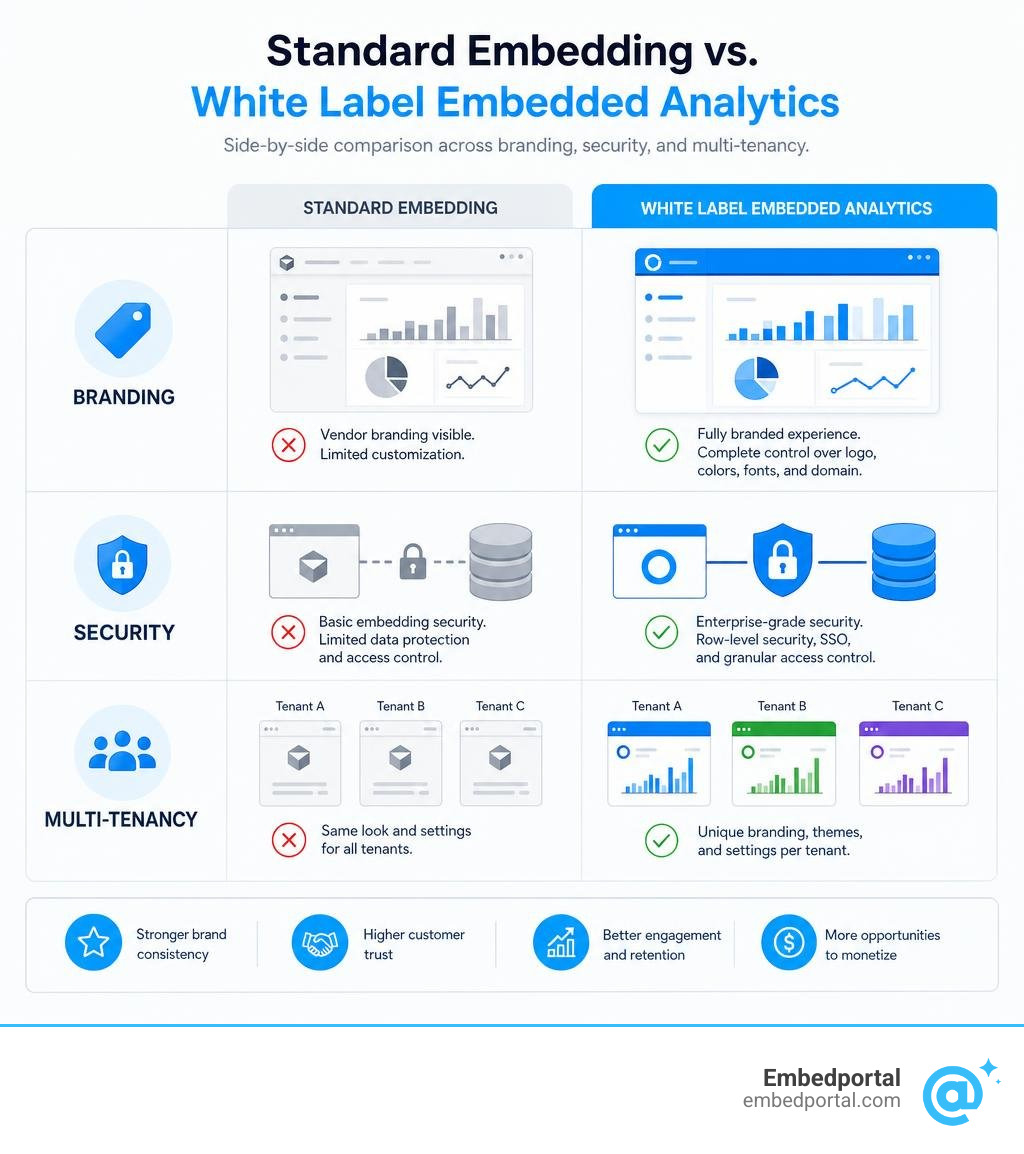
It goes further than standard embedding. With standard embedding, you get dashboards inside your app. With white labeling, those dashboards look, feel, and behave as if you built them from scratch.
Here’s a quick breakdown of what that means in practice:
| Feature | Standard Embedding | White Label Embedded Analytics |
|---|---|---|
| Vendor branding visible | Often yes | No — fully removed |
| Custom logo, colors, fonts | Partial | Yes — full control |
| Custom domain | Rarely | Yes (e.g. analytics.yourbrand.com) |
| Branded exports and emails | No | Yes |
| Multi-tenant theming per customer | Rare | Yes |
| Feels native to your product | No | Yes |
This distinction matters more than most product teams realize — at first.
The moment a customer notices an unfamiliar logo or a mismatched font inside your product, trust erodes. They’re no longer using your analytics. They’re using someone else’s tool that’s been bolted onto yours.
And the business stakes are real. Research shows that 57% of product leaders say embedded analytics has a direct impact on revenue. Companies that get the experience right — truly native, fully branded, seamlessly integrated — see measurable gains in engagement, retention, and even new revenue streams.
But getting it right is harder than it looks. You’re balancing branding depth, multi-tenant data isolation, row-level security across BI vendors, and consistent auth — all while your core product roadmap doesn’t stop moving.
This guide is built for product and analytics leads who are past the “should we embed analytics?” question and deep into the “how do we do this properly?” one.
Understanding White Label Embedded Analytics and How It Works

To understand how White Label Analytics functions, we must first look at the terminology. In the business intelligence space, terms like OEM analytics, custom analytics, and white-label BI are often used interchangeably. At their core, they all describe the same goal: delivering advanced reporting capabilities that match your unique brand identity perfectly.
When we talk about Embedded Analytics, we are talking about putting data visualizations inside an application. But white-labeling is the next evolution of this concept. It ensures that the visual layer, the navigation, and even the automated notifications sent to users are entirely stripped of third-party references.
For developers, this means the analytics platform functions as a background engine. The engine handles the heavy lifting of data processing, query optimization, and visualization rendering, while your application retains complete ownership over the user interface (UI) and user experience (UX).
Why Standard Embedding Falls Short of True White Label Embedded Analytics
Standard embedding is often a quick fix that leads to long-term user experience debt. When you use basic embedding, you typically drag an out-of-the-box dashboard into a container and call it a day.
However, this approach leaves obvious clues that the analytics are not native. You might see the BI vendor’s logo during loading states, or find their name in the footer of a PDF export. Even worse, the visual consistency of your application is compromised. Standard BI tools come with their own pre-set design languages—their own buttons, scrollbars, and chart palettes—which clash with your product’s carefully crafted UI.
This mismatch directly impacts user trust and product adoption. When a user transitions from your sleek SaaS platform to a clunky, mismatched reporting tab, it signals that you outsourced a core feature. As we explore in our article, The Iframe is the Easy Part: What Embedded Analytics Needs, a successful integration requires deep visual harmony and native-feeling interactivity, not just a simple window to another app.
What Parts of an Analytics Platform Can Be White-Labeled?
A true white-label solution allows you to customize every single touchpoint. It is not just about swapping a logo in the top-left corner.
Here is what you should be able to customize:
- The User Interface: This includes matching the exact typography, button styles, borders, margins, and background colors of your application using CSS variables and dynamic theming.
- Custom Domains: Your users should access their data via your own domain structure (e.g.,
insights.yourcompany.com) rather than a vendor-hosted URL. - Branded Exports: When users download reports as PDFs, CSVs, or Excel sheets, these files must feature your company’s headers, footers, and brand colors.
- Custom SMTP: Automated email alerts, scheduled PDF reports, and system notifications should be sent from your own email servers using your domain, preventing any vendor exposure.
Whether you are implementing a White Label Tableau setup or working with other major BI tools, achieving this level of control ensures your users get a unified experience across the entire reporting lifecycle.
Architectural Approaches and Multi-Tenancy

When integrating analytics, developers must choose an integration method that balances customization depth with implementation speed. The ideal Embedded Analytics Platform will offer multiple ways to connect to your application’s frontend and backend systems.
iFrame Embedding vs. SDK-Based Integration
The classic debate in embedded BI is whether to use iFrames or software development kits (SDKs).
An iFrame works by loading an external interface inside an isolated window on your page. It is incredibly fast to set up, but it acts as a black box. You cannot easily pass user interactions between your parent application and the dashboard, and styling is highly restricted.
Conversely, an SDK-based integration allows you to inject analytics directly into your application’s component tree. For example, if you are working on a White Label Power BI deployment, using the developer SDK allows you to use JavaScript to interact with the DOM, listen to dashboard events, and trigger custom workflows inside your SaaS application based on what the user clicks.
Headless and API-First White Label Embedded Analytics
For teams that demand absolute control over their UI, headless or API-first analytics is the ultimate approach. In this model, you do not use the BI vendor’s pre-built charts at all. Instead, you query the vendor’s REST APIs to retrieve raw analytical data, and then render that data using your preferred charting libraries like ChartJS, amCharts, or ApexCharts.
This approach completely eliminates vendor design footprints and ensures the charts are literally built from your own code components. For a deeper technical dive, you can read more in this White Label Embedded Analytics: How-to Guide for Developers.
Enforcing Data-Layer Isolation and Row-Level Security
In a multi-tenant SaaS application, security is paramount. You cannot rely on frontend visual filters to separate customer data—clever users can easily bypass UI-level filters. Instead, data-layer isolation must be enforced at the query level before any data is sent to the browser.
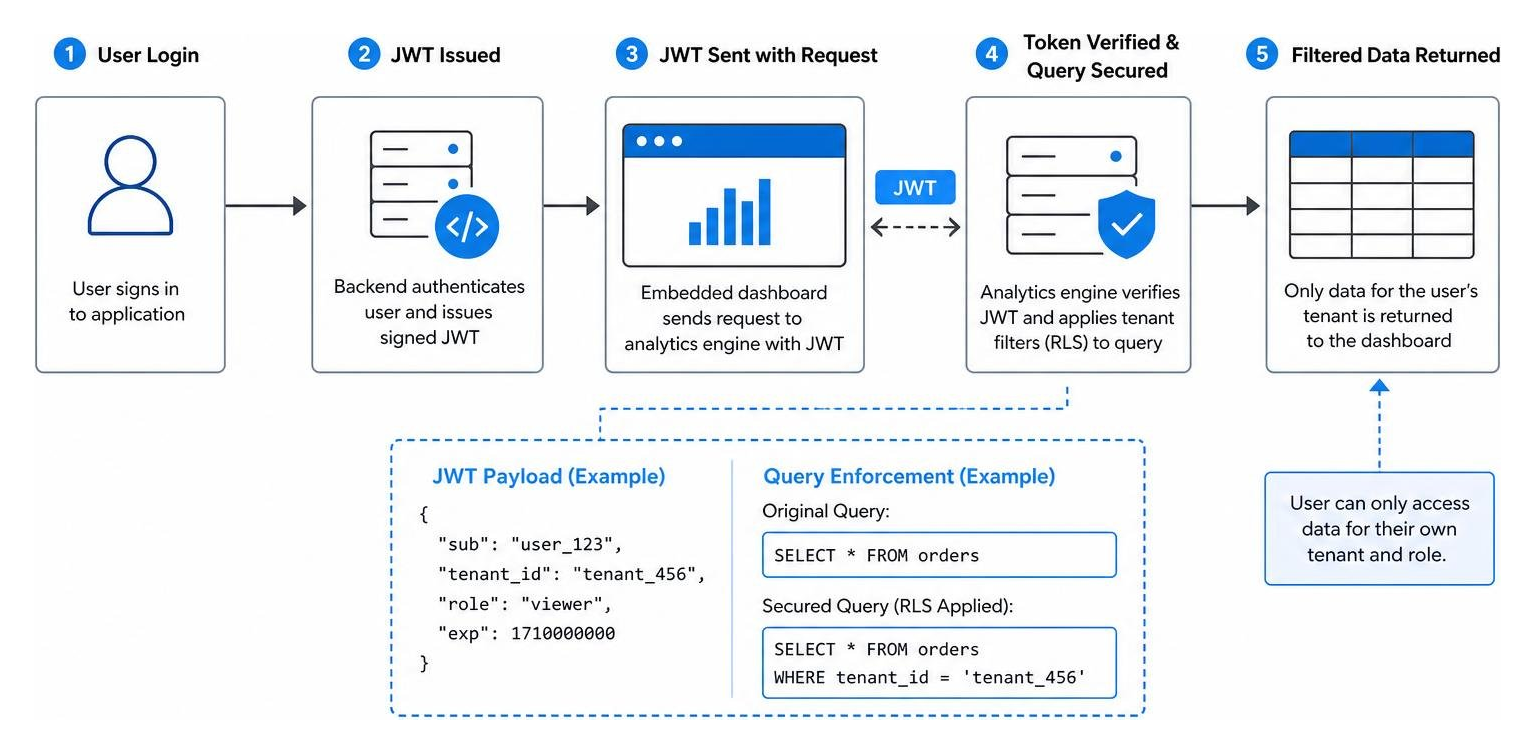
This is achieved by combining Single Sign-On (SSO) with Row-Level Security (RLS). When a user logs into your SaaS platform, your backend generates a secure, signed JSON Web Token (JWT). This token contains the user’s identity, tenant ID, and role permissions. When the embedded dashboard requests data, this token is passed to the analytics engine, which dynamically appends tenant filtering parameters to the database query. This ensures that Customer A can never, under any circumstances, see the data of Customer B. Setting up this secure workflow is a critical step when configuring Embedded Analytics for SaaS.
Evaluating and Implementing a White-Label Solution
Choosing whether to build your reporting engine in-house or buy a platform is one of the most critical decisions a product team will make.
| Evaluation Factor | Building In-House | Buying a White-Label Platform |
|---|---|---|
| Initial Time-to-Market | 6 to 12 months | 4 to 8 weeks |
| Initial Engineering Cost | $500K – $1.5M+ (Multiple FTEs) | Software licensing fees |
| Ongoing Maintenance | High (Requires dedicated data team) | Low (Handled by the vendor) |
| Feature Depth | Basic charts and tables | Advanced filtering, AI queries, exports |
| Multi-Vendor Support | Impossible without rebuilding | Native connection to multiple BI tools |
As the table shows, building from scratch requires a massive, ongoing commitment of engineering resources. Most teams quickly realize that their engineers’ time is better spent building the core SaaS product, rather than maintaining a complex BI infrastructure. For a comprehensive look at the top options on the market, check out our guide on the Best Embedded Analytics Tools.
Key Evaluation Criteria for SaaS Product Leaders
If you decide to buy, you must evaluate vendors based on production-level realities rather than simple demo features.
First, consider customization depth. Can you completely remove all vendor footprints, including loading screens and error messages?
Second, look at deployment flexibility. Does the vendor support cloud, on-premise, or self-hosted VPC deployments to comply with your industry’s security standards?
Third, evaluate pricing models. Many traditional BI vendors use user-based pricing, which can quickly become cost-prohibitive as your SaaS customer base grows. Look for flat-rate, deployment-based pricing models that align with your growth. You can learn more about navigating these complex structures in our analysis of How Embedded Analytics Pricing Actually Works in 2026 and our general guide to Embedded Analytics Pricing.
Finally, look for multi-vendor BI support. If your company uses Tableau for one department and Power BI or Metabase for another, managing multiple separate embedding setups is a nightmare. This is where we at Embedportal shine: our platform allows you to embed dashboards from Tableau, Power BI, QuickSight, and Metabase under a single, unified brand identity in less than an hour.
Step-by-Step Implementation Timeline
A successful rollout of white-label analytics typically follows a structured 30-to-60-day timeline:
- Weeks 1-2: Data Prep & Connection: Connect your databases or data warehouses directly to your BI tools. Establish your data models and define your tenant isolation rules.
- Week 3: Visual Styling & CNAME: Set up your custom domain (CNAME) and apply your branding CSS variables to match your application’s theme.
- Week 4: Auth & SSO: Configure JWT-based SSO token exchange to handle authentication and row-level security.
- Weeks 5-6: Beta Testing: Release the analytics module to a small cohort of active users. Gather feedback on load times, usability, and report relevance.
- Week 7+: GA Rollout & Monetization: Launch the feature globally. You can package advanced analytics as a premium tier to drive expansion revenue.
For more strategic advice on the business impact of these steps, explore White Label Analytics Explained: Benefits, Use Cases & Examples.
Frequently Asked Questions about White-Label BI
What is the difference between white label BI and OEM analytics?
The difference lies primarily in business licensing versus software presentation. OEM (Original Equipment Manufacturer) analytics refers to the commercial licensing agreement that legally permits you to bundle, resell, and distribute a third-party BI platform as part of your own software. White-labeling, on the other hand, refers specifically to the technical and visual customization layer that strips out the vendor’s branding and replaces it with yours. In short, OEM is the business model, while white-labeling is the user-facing design. You can read more about how these concepts merge in Embedded Analytics and White Label Solutions.
Does white-labeling analytics impact performance or security?
No, white-labeling is simply a visual and presentation layer applied on top of the underlying BI engine. It does not alter query execution speeds or core security protocols. However, to maintain high performance at scale, we recommend implementing backend caching strategies with tenant-scoped keys. This ensures that frequently run queries load instantly without risking cross-tenant data exposure.
Can we embed AI and natural language queries under our brand?
Absolutely. Modern white-label platforms allow you to embed conversational AI and natural language search directly into your application. Your users can type analytical questions in plain English and receive instant, beautifully styled charts in return—all without ever realizing a third-party AI model or BI engine is powering the workflow behind the scenes.
Conclusion
Integrating analytics into your SaaS product shouldn’t mean sacrificing your brand identity or spending a year of your engineering team’s life rebuilding a BI tool from scratch. With white label embedded analytics, you can deliver world-class reporting that feels completely native to your application.
At Embedportal, we help you skip the development headache entirely. Our platform allows you to connect your existing dashboards from Tableau, Power BI, QuickSight, and Metabase, apply your exact brand identity, and secure them with multi-tenant row-level security and SSO—all in under an hour.
Ready to see how seamless your customer-facing analytics can be? Explore Embedportal’s Embedded BI Platform and start building today.