No-Code to SDK: Navigating the Best White Label Analytics Tools
Why White Label Analytics Is Now a Core Product Decision for SaaS Teams
White label analytics lets you embed fully branded dashboards, reports, and data experiences directly inside your product — with no visible trace of a third-party tool.
If you’re evaluating platforms right now, here’s the short version:
| What you want | What to look for |
|---|---|
| Full branding control | SDK-based embedding, not iFrame |
| Safe multi-tenant data | Isolation enforced at the query layer |
| Predictable costs at scale | Flat/fixed pricing, not per-seat |
| AI that respects your auth | NLQ scoped to tenant and role |
| Fast time to production | Platforms with 1-2 week onboarding |
The platforms reviewed in this guide — and how they compare on each of these criteria — are covered in the sections below.
Here’s the reality most product teams hit eventually: your customers are asking for better reporting, your competitors are already shipping it, and someone in a planning meeting suggests building it in-house.
That suggestion sounds reasonable. It rarely is.
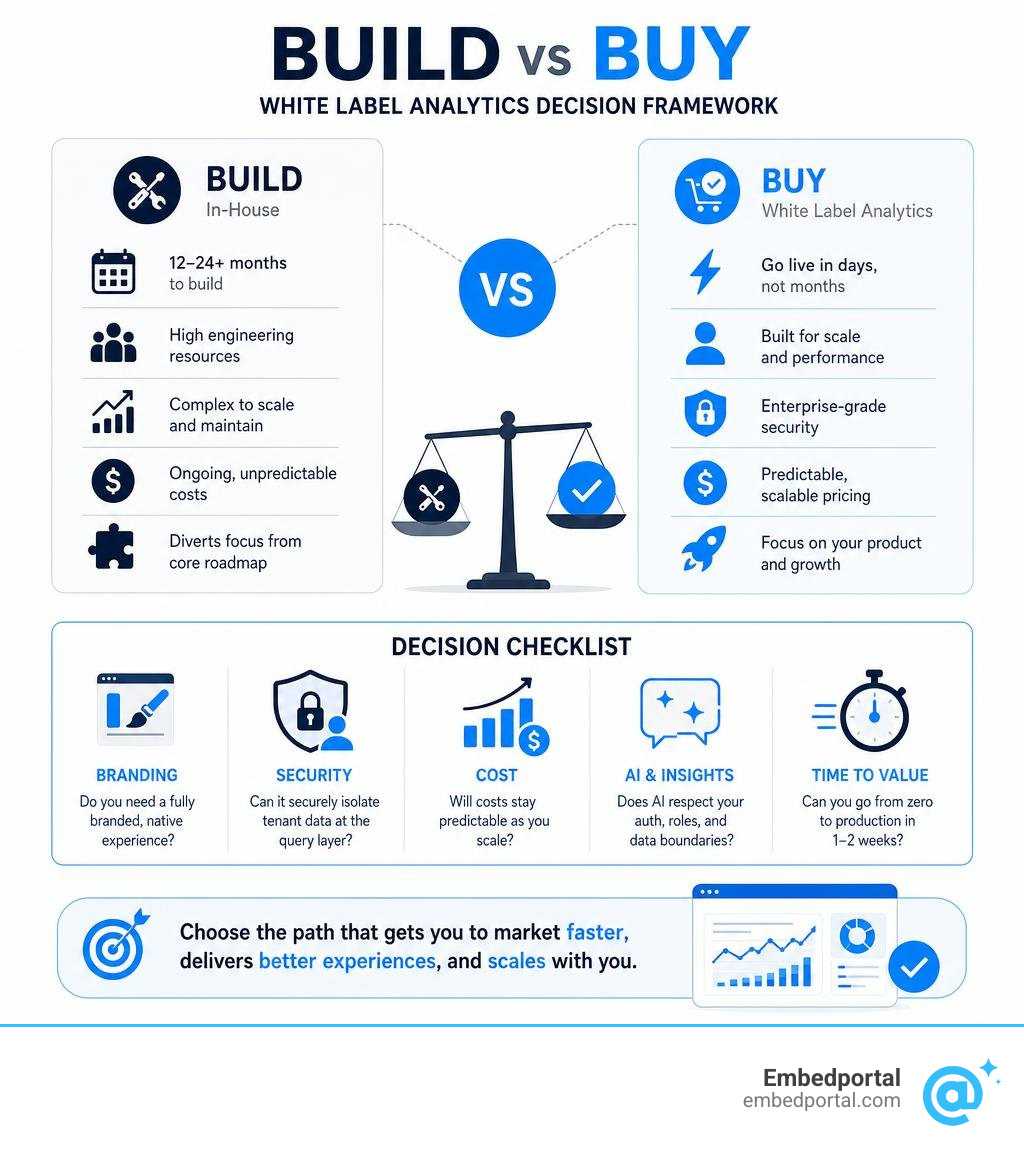
Building a reporting layer from scratch typically ties up a senior engineering pod for 12 to 24 months. And when it ships, it still falls short of what a dedicated analytics platform delivers out of the box. One SaaS platform serving independent pharmacies chose to embed instead — and had real-time prescription and inventory dashboards live in one week, versus the months their engineers had estimated for a custom build.
The decision isn’t just about speed. It’s about where your engineers spend their time, how your brand shows up inside your product, and whether your analytics can scale as your customer base grows — without your costs scaling just as fast.
57% of product leaders say embedded analytics directly impacts revenue. Yet most teams still evaluate platforms based on demo features rather than what happens at production scale, with real tenants, real data volumes, and real branding requirements.
This guide is built around the criteria that actually matter once you’re past the demo.
What is White Label Analytics and Why Does It Matter?
When we talk about white label analytics, we are talking about the complete integration of data visualization, reporting, and dashboard capabilities directly into your software application, styled so seamlessly that your users have no idea a third-party tool is running under the hood. It is your brand, your colors, your typography, and your domain.
In July 2026, user expectations are higher than ever. Customers do not want to export their data to a separate spreadsheet tool or jump to a separate browser tab to run a clunky report. They want contextual, real-time insights served right where they already work. Delivering this native experience requires a shift from basic dashboard sharing to a fully integrated, customized reporting environment.
To understand why this matters, we have to look at how organizations have traditionally handled data and how modern software delivery has changed. You can read more about the foundations of this approach in our guide to embedded analytics.
White Labeling vs. Embedded Analytics vs. Traditional BI
It is common to hear these terms thrown around interchangeably, but they represent very different levels of integration, user experience, and technical architecture.
- Traditional BI (Business Intelligence): This is the classic standalone setup. Think of desktop or cloud-based software where internal analysts build reports for internal stakeholders. Users must log into a separate portal, navigate a generic interface, and manually pull the data they need. There is no brand customization, and it is entirely disconnected from your core SaaS application.
- Standard Embedded Analytics: This is the act of placing a dashboard inside another application, typically using a basic iFrame. While the dashboard is technically located within your app’s borders, the integration is often skin-deep. Users might see the BI vendor’s logo, experience mismatched fonts, or encounter separate login prompts. It feels like an external tool wedged into your workspace.
- White Label Analytics: This is the gold standard. It goes beyond simple placement to achieve absolute visual and structural harmony. Every pixel matches your design system. The domain points to your own subdomain, such as
analytics.yourcompany.com. The email alerts come from your mail server, and the charts adapt dynamically to dark and light modes depending on your user’s preferences.
To see how these options stack up technically and operationally, you can review our detailed breakdown to compare embedding approaches.
The Business Benefits of White Label Analytics
Investing in a true white-label data experience yields immediate returns across product engagement, client retention, and revenue expansion. When done right, analytics transitions from a costly must-have compliance checkbox to a high-yield product feature.
First, it significantly increases user engagement and product adoption. When users can answer their own complex business questions without leaving your application, they spend more time in your software. For example, marketing automation platforms often see report usage shoot up by 60% or more after launching customizable, fully branded liveboards.
Second, it unlocks entirely new revenue streams. Many SaaS companies package their analytics into a tiered monetization model. You can offer basic static reports in your entry-level plans, interactive customizable dashboards in your professional tiers, and premium AI-driven predictive insights or search-based query builders in your enterprise packages. According to industry data, SaaS vendors who launch a paid analytics tier on top of an embedded BI layer report a median revenue lift of 2.4x.
Finally, it preserves absolute brand consistency. Your brand is your promise to your customers. Introducing a disjointed, third-party branded reporting tool chips away at the premium feel of your software. By maintaining a single, unified visual identity, you build trust and deliver a polished enterprise-grade experience. Discover how this scales specifically for software products in our article on embedded analytics for SaaS.
Build vs. Buy: Engineering and Economic Realities in 2026
The classic engineering dilemma: Should we build this ourselves or buy an off-the-shelf solution?
In the early days of SaaS, building a basic chart library with open-source tools seemed straightforward. But in 2026, a modern analytics experience requires much more than rendering a bar chart. It requires robust user management, complex access controls, multi-tenant data isolation, automated report scheduling, export engines such as PDF, CSV, and Excel, and conversational AI search interfaces.
Let’s look at the real-world economics of building these capabilities in-house versus utilizing a modern white label platform:
| Evaluation Metric | Building In-House (DIY) | Purchasing a White Label Platform |
|---|---|---|
| Initial Engineering Cost | $1.4M to $2.6M (6-8 dedicated engineers) | $90K to $250K (annual licensing fees) |
| Time-to-Market | 9 to 14 months of development | 3 to 8 weeks to full production |
| Maintenance Overhead | High (ongoing bug fixes, API updates, scaling) | Low (managed by the platform vendor) |
| Feature Depth | Limited to basic charts and custom code | Advanced (NLQ, dynamic filtering, multi-source joins) |
| Opportunity Cost | High (diverts product focus from core IP) | Zero (engineers focus on your main product features) |
Building in-house is a continuous commitment. As soon as you ship version 1.0 of your custom-built reporting tool, your customers will immediately ask for customized scheduling, deeper drill-downs, and cross-database joins. Suddenly, your core product roadmap is held hostage by dashboard maintenance.
Technical Architecture: SDKs, iFrames, and Multi-Tenancy
Under the hood, the success of your white-label integration hinges on your technical implementation. If your architecture is brittle, your user experience will suffer, and your security posture will be compromised.
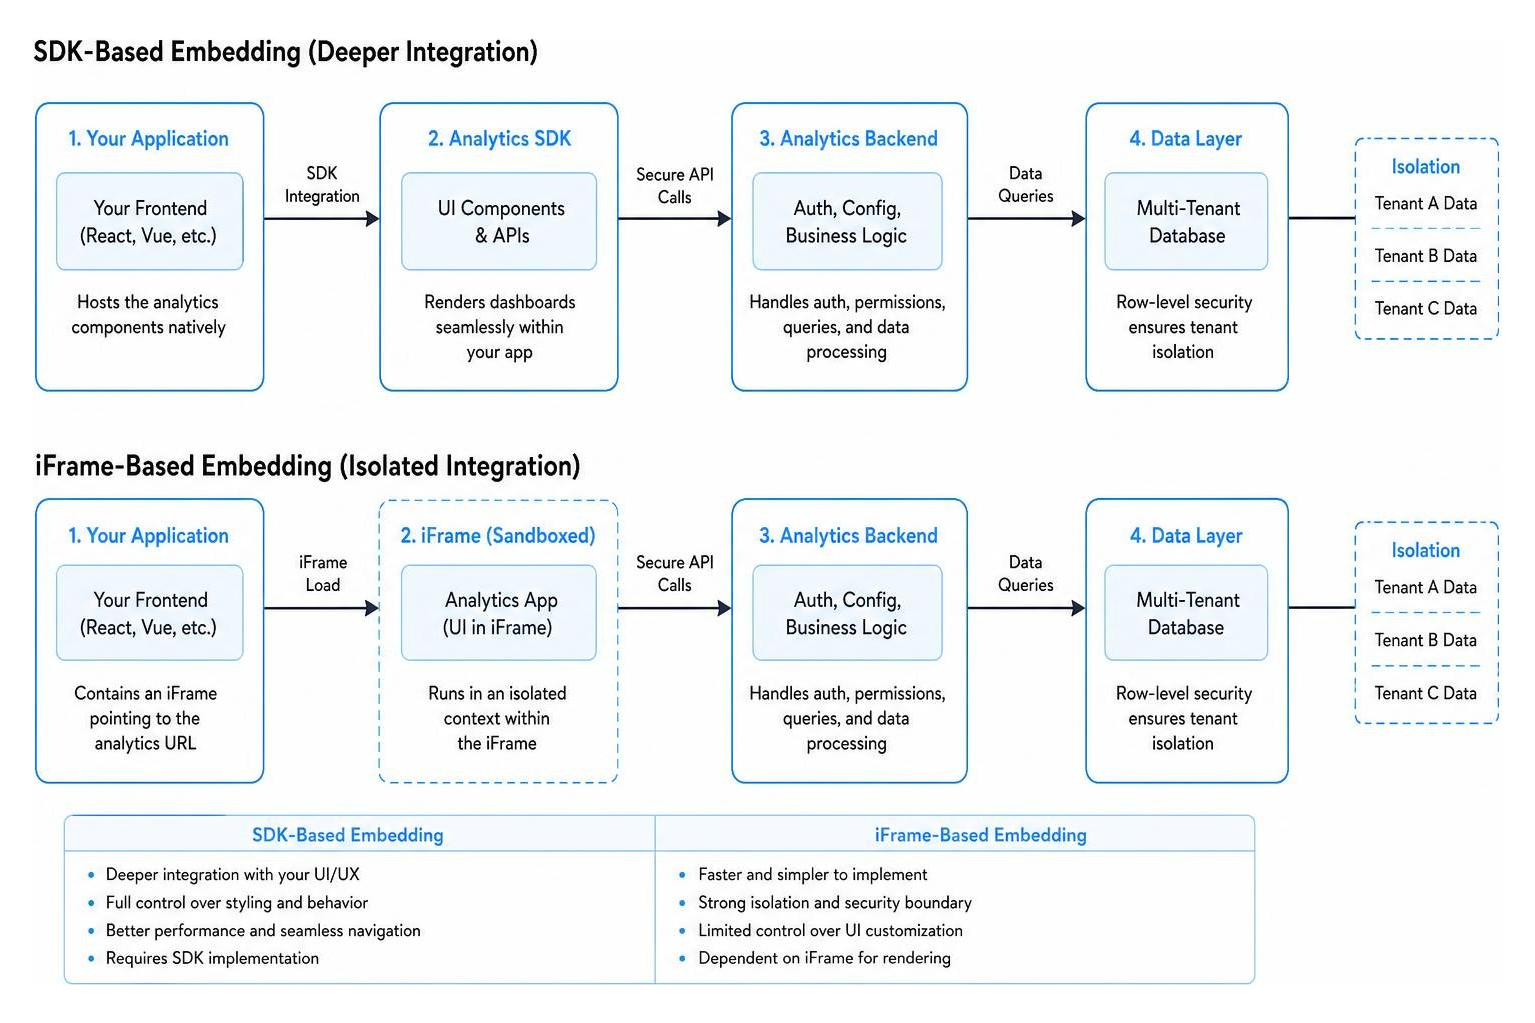
When selecting an embedded analytics platform, you must evaluate how the software interacts with your application’s front-end code and how it handles data isolation at the database level.
SDK-Based vs. iFrame-Based Embedding Approaches
The method you choose to embed your dashboards determines your “customization ceiling”—the maximum level of control you have over the end-user experience.
- iFrame-Based Embedding: An iFrame acts as an isolated window displaying an external website inside your application. It is incredibly quick to set up—often requiring just a single secure URL dropped into an HTML tag. However, because of browser security policies and the nature of iFrames, your application cannot easily communicate with the dashboard. You can style the outer container, but you cannot easily alter the buttons, menus, or interactive elements inside the dashboard itself. If you need a deep, pixel-perfect integration, iFrames can feel restrictive.
- SDK-Based Embedding: A JavaScript SDK integrates the analytics components directly into your application’s native DOM or component tree (such as React, Angular, or Vue). This removes the customization ceiling entirely. Because the charts live inside your application’s actual code, you can use CSS variables for dynamic theming, bind application buttons to dashboard actions, and pass user parameters seamlessly.
The choice between these two approaches heavily influences development timelines and your long-term embedded analytics pricing considerations, as SDK-based platforms often require more technical expertise upfront but yield a far superior product experience.
Multi-Tenancy and Data-Layer Isolation
In a multi-tenant SaaS application, different customer accounts (tenants) share the same underlying software infrastructure. The absolute golden rule of software development is that Tenant A must never see Tenant B’s data. A single data leak can destroy a software company’s reputation overnight.
Because of this, multi-tenancy in white label platforms must be enforced at the data/query layer, never at the user interface layer.
If a platform merely hides other tenants’ data using UI-level filters, a tech-savvy user could inspect the network requests in their browser, modify the parameters, and pull records belonging to another company. True security requires that the underlying query itself is modified before it ever touches your database.
This is accomplished through two primary methods:
- Workspace Isolation: The platform provisions completely separate, containerized workspaces or databases for each tenant.
- Row-Level Security (RLS): The platform uses a single database but dynamically appends filtering parameters to every query based on the authenticated user’s tenant ID.
To ensure your setup is bulletproof, you should design your architecture around robust multi-tenant analytics principles and implement strict row-level security protocols.
How to Evaluate and Choose a Platform
Choosing the right partner is a multi-year decision. Migrating away from an analytics vendor after you have embedded their dashboards across hundreds of client accounts is incredibly disruptive.

When reviewing your options, look past the polished sales presentations and focus on how the platform performs under production conditions.
Key Criteria for Evaluating a White Label Analytics Platform
To make an objective decision, evaluate vendors across these four critical pillars:
- Branding & UI Customization Depth: Can you completely eliminate the vendor’s digital fingerprint? Ensure you can point a CNAME record to serve dashboards from your custom domain, customize automated email notifications, and apply dynamic CSS themes that adapt on the fly.
- Data Connectivity and Performance: Does the platform connect natively to your modern data stack (SQL, NoSQL, APIs, or cloud warehouses like Snowflake and BigQuery) with zero-ETL requirements? It should offer robust caching layers and load-balancing capabilities to maintain sub-second load times even with massive datasets.
- Enterprise-Grade Security: Look for platforms that support single sign-on (SSO), SAML, JWT authentication, and automatic user provisioning via SCIM. The vendor must hold SOC 2 Type II certifications and support compliance frameworks like HIPAA or GDPR. Review how the platform manages external user access to protect sensitive client dashboards.
- Developer Tooling: Does the vendor provide developer-friendly SDKs, comprehensive API documentation, and sandboxed testing environments? The faster your engineering team can build, test, and deploy, the sooner you will see a return on your investment.
Pricing Models: Fixed vs. Usage-Based Scaling
One of the biggest traps product teams fall into is failing to model pricing at 3x and 10x their current user volumes. A pricing structure that seems affordable during a pilot phase can quickly become a massive cost center as your customer base expands.
There are two primary pricing models in the white-label space:
- Usage-Based or Per-Seat Pricing: Under this model, your costs increase with every new user, query, or tenant you add. While this keeps entry costs low, it creates a massive financial disincentive for you to drive product adoption. If your analytics features become wildly popular, your software bill will skyrocket, eating into your SaaS margins.
- Fixed or Flat-Platform Pricing: This model charges a predictable, flat fee based on your deployment model or application instances, regardless of how many end-users or dashboard viewers you onboard.
For SaaS companies looking to scale their software efficiently, flat-platform pricing is almost always the superior choice. It allows you to offer analytics to unlimited users without worrying about unpredictable monthly bills. To dive deeper into these dynamics, check out our analysis of dashboard data access management.
AI and Natural Language Query Governance
In 2026, basic static dashboards are no longer enough. End-users want to ask ad-hoc questions about their data using natural language and receive instant, accurate visualizations in return.
However, embedding conversational AI and Large Language Models (LLMs) inside your product introduces significant governance and security risks. You must ensure that:
- AI respects your data boundaries: The LLM must operate within your existing authentication and row-level security models. If a user asks, “What was our top-performing region last quarter?”, the AI must only pull data from that specific user’s tenant.
- Data remains private: Your customer’s proprietary data must never be used to train public LLM models.
- Token costs are predictable: Conversational analysis can consume massive computational resources. Choose platforms that offer built-in guardrails and caching to keep token expenses manageable.
Frequently Asked Questions about White Label Analytics
To help you cut through the noise, we have compiled answers to the most common questions product teams ask when researching white-label solutions.
What is the difference between white label analytics and standard embedded analytics?
Standard embedded analytics simply places a third-party dashboard inside your application, often retaining the vendor’s branding, logos, and styling. White label analytics completely strips away the vendor’s identity, allowing you to rebrand the entire interface, host it on your own domain, customize system emails, and deliver a seamless, native user experience.
How does multi-tenancy protect customer data in a white-label setup?
Multi-tenancy ensures absolute data isolation between different customer accounts. In a secure white-label environment, data protection is enforced at the query level. When a user requests a dashboard, the platform automatically applies centralized row-level security filters, ensuring the database only returns records matching that user’s specific tenant ID.
Can we white-label existing BI tools?
Yes, but doing so natively can be incredibly complex, expensive, and time-consuming. Standard BI platforms are built primarily for internal enterprise use, meaning their external user licensing models can be cost-prohibitive, and their branding customization options are often limited.
To bypass these hurdles, many teams use a unified embedding framework. This allows you to combine and white-label dashboards from multiple sources. If you are currently utilizing legacy BI systems, we recommend reading our dedicated strategy guides on white-labeling enterprise dashboard deployments and white-labeling advanced visual analytics to see how to achieve a polished look without the enterprise headache.
Conclusion
Providing your users with beautiful, intuitive, and secure data insights is no longer a luxury – it is a baseline requirement for modern software products.
While the temptation to build reporting tools in-house is always present, the opportunity cost, engineering overhead, and long-term maintenance realities make buying a dedicated white-label solution the smarter strategic choice for growing SaaS teams. It frees your developers to focus on your core product innovations while giving your clients immediate access to world-class reporting.
At Embedportal, we believe you shouldn’t have to choose between speed and customization. Our platform is built specifically to bridge this gap, enabling your team to embed multi-vendor analytics from your existing BI stack with unified branding, robust row-level security, and seamless single sign-on (SSO) in under an hour.
Ready to transform your user experience and unlock new revenue streams? Explore how we can elevate your application with our industry-leading white label analytics platform today.