The Ultimate Guide to White Label Dashboards, BI, and Reporting
What Is a White Label Dashboard? (Quick Answer)
A white label dashboard is an analytics interface that you can fully rebrand as your own product — replacing every trace of the vendor’s identity with your logo, colors, domain, and UI — so your clients or end users never know a third-party tool is running underneath.
At a glance:
- What it is: A data dashboard built by one vendor, rebranded and delivered by another business as their own
- Who uses it: Marketing agencies, SaaS companies, ISVs, and enterprises serving multiple clients or tenants
- Why it matters: Clients see your brand — not a third-party tool’s logo — across every report, domain, and email
- How it works: Connect your data sources, apply your branding (logo, colors, custom domain), and share reports or embed dashboards directly into your product
- Key difference from standard embedded analytics: Standard embedding puts a dashboard inside your app. White labeling goes further — it removes all vendor fingerprints so the entire experience feels like your product
Here’s a scenario that happens more often than most teams admit: a client notices a competitor’s logo in the corner of a dashboard during a monthly results call and asks, “Wait — are you just reselling someone else’s software?” That moment quietly damages trust in a way that’s hard to recover from.
Whether you’re a marketing agency delivering client reports or a SaaS product team shipping analytics to customers, the reporting layer is part of your brand. Showing up with someone else’s logo attached is a problem.
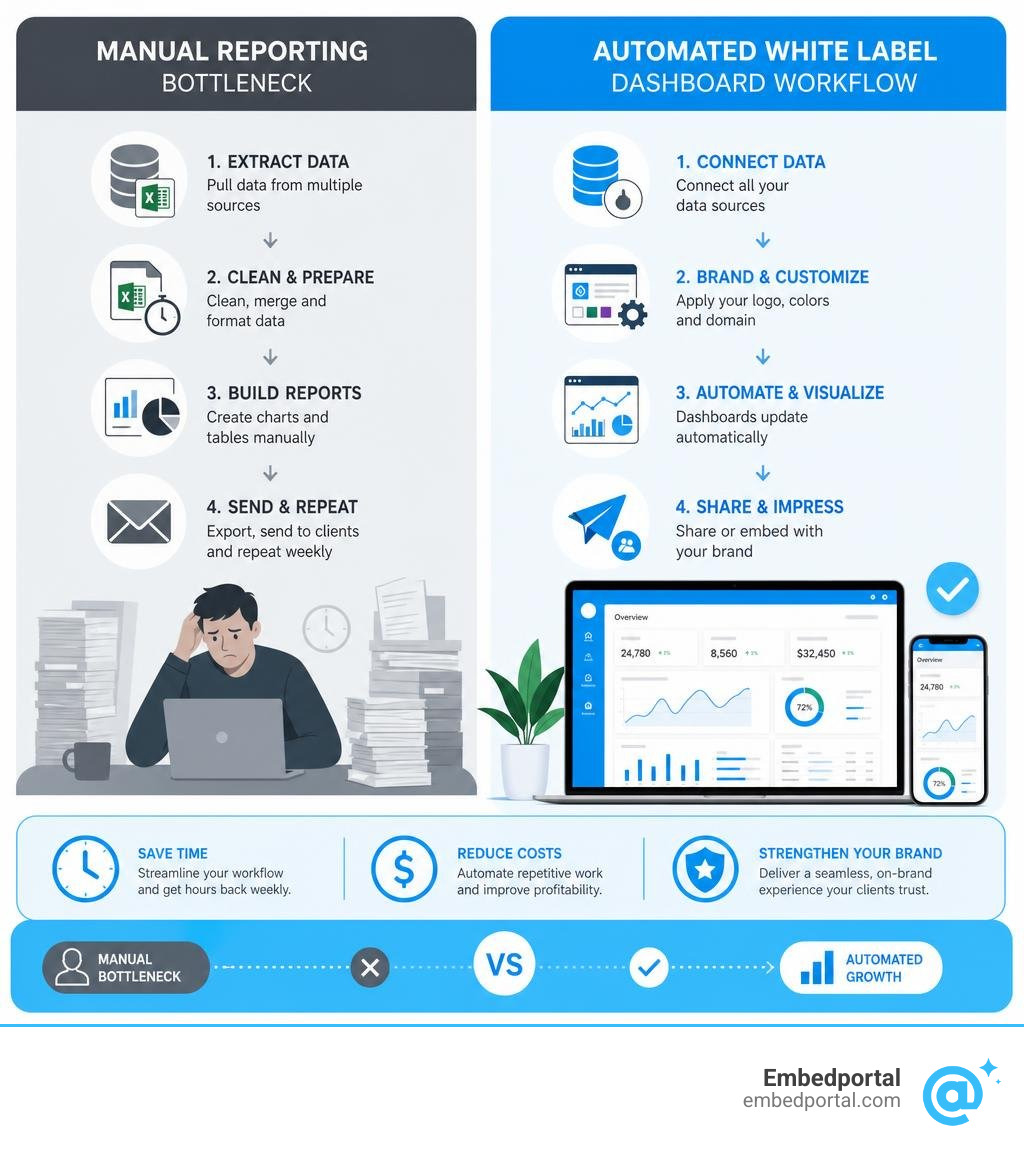
In 2026, the tooling has matured significantly. Most agencies still spend 10–15 hours per week on manual reporting — work that costs an estimated $78,000–$117,000 per year at standard agency rates. Modern white label dashboard platforms can cut that to 2–3 hours weekly. But not all platforms are built the same, and the difference between a fast demo and a production-ready deployment can be months and hundreds of thousands of dollars.
This guide breaks down exactly what white label dashboards are, what separates the good platforms from the frustrating ones, and how to choose the right solution for your use case.
What is a White Label Dashboard and How Does It Work?
To understand how a white label dashboard functions, it helps to look at the mechanics of white-labeling itself. At its core, white-labeling is about maintaining a seamless brand identity. It ensures that when a client logs in to view their data, they experience complete data transparency and a polished user experience without any distracting third-party footprints.
For a deeper dive into the technical mechanics, check out our guide on White Label Analytics.
When you implement a white label dashboard, the software provider handles the complex backend engineering—data connectors, query processing, visualization rendering, and infrastructure scaling. Your team handles the frontend presentation, configuring the platform to look exactly like your proprietary technology.
A fully white-labeled dashboard platform lets you customize:
- The Domain: Instead of sending clients to a generic vendor URL, you host the dashboard on a custom domain (e.g.,
analytics.yourcompany.com). - The Visuals: Every chart, font, button, and background uses your exact hex color codes and brand guidelines.
- The Communication: Automated email reports, security alerts, and password reset notifications are sent from your own email server (e.g.,
reports@yourcompany.com).
White Label Dashboard vs. Standard Embedded Analytics
While people often use these terms interchangeably, there is a fundamental difference in their execution:
- Standard Embedded Analytics: This is a delivery model. It refers to placing a dashboard inside another application, often using an iFrame or a basic widget. However, standard embedding does not guarantee the removal of vendor branding. You might still see a “Powered by” logo, vendor-branded loading screens, or links to the vendor’s documentation.
- White Label Dashboards: This is a branding model. It focuses on the complete erasure of the software vendor’s identity. From the login screen and favicon to the underlying error messages and metadata, the vendor is completely invisible. The entire interface is designed to match your application’s native look and feel.
The Difference Between SDK-Based and iFrame-Based Embedding
When deploying white-label dashboards, the integration method you choose dictates your customization ceiling and development timeline.
- iFrame-Based Embedding: This is the quickest way to get to market. An iFrame loads the dashboard inside an isolated container on your webpage. While highly secure and simple to deploy, it comes with limitations. You can change the colors and logos inside the container, but you cannot easily control the internal UI components, trigger programmatic page actions, or seamlessly bind the dashboard to your application’s native navigation.
- SDK-Based Embedding: An SDK-based architecture integrates the dashboard components directly into your application’s native component tree (using frameworks like React, Vue, or Angular). Instead of loading an external window, the dashboard elements render as native code. This gives your developers complete API control over interactions, event listeners, and programmatic filtering, ensuring there is no customization ceiling.
Why Modern SaaS Companies and Agencies Need Custom Reporting
Whether you are scaling a SaaS product or running a fast-growing marketing agency, manual reporting is a silent killer of productivity and profit margins.
For agencies, compiling monthly reports across multiple channels (PPC, SEO, social media, and email) is a massive time sink. Most agencies spend 10 to 15 hours weekly creating reports manually. At a standard billable rate of $150 per hour, this manual effort costs between $78,000 and $117,000 annually per account manager. Automating this process with a white label dashboard reduces manual work to just 2 to 3 hours weekly, saving agencies over $60,000 to $100,000+ per year while freeing up teams to focus on strategy and client acquisition.
SaaS products face a similar challenge. Today, clients expect sophisticated analytics as a core product feature rather than an afterthought. In fact, industry data shows that 96% of SaaS products now embed analytics in some form.
To explore how this fits into your software roadmap, read more about choosing an Embedded Analytics Platform.
Key Benefits of a White Label Dashboard for Client Retention
Client retention in both SaaS and agency models relies on demonstrating consistent, clear value. Branded dashboards strengthen client relationships in several key ways:
- Eliminating the “Middleman” Question: When clients see a third-party vendor’s logo on their reports, they may wonder if they could simply buy that tool themselves and bypass your services. A fully branded portal positions your team as the sole source of proprietary insights.
- Interactive Self-Service: Instead of waiting for a static PDF report at the end of the month, clients can log into a secure portal to filter dates, drill down into specific metrics, and explore data in real time. This reduces back-and-forth communication and builds trust.
- Automated Consistency: Scheduled email notifications and automated data refreshes ensure that your clients receive professional, on-brand updates on a predictable schedule without any manual intervention from your team.
Brand Credibility and Competitive Differentiation in 2026
In a crowded market, presenting polished, professional client portals elevates your brand’s credibility. It reassures stakeholders that your business stands firmly behind its reported metrics.
By offering a custom-branded portal, you transform reporting from a basic administrative task into a competitive differentiator. Instead of selling “services,” you are selling a proprietary platform experience. This increases the perceived value of your offering, allowing you to command premium pricing and win larger enterprise accounts that require strict data governance and polished interfaces.
Key Features to Look For in a White Label Analytics Platform
Choosing the right platform requires looking past the initial sales demo and evaluating how the software performs under real-world production stress.

Multi-Tenancy and Row-Level Security at the Data Layer
Multi-tenancy is the most critical architectural requirement for any client-facing dashboard. If you are serving multiple customers from a single application, you must guarantee that Customer A can never see Customer B’s data.
- UI-Level Filtering vs. Data-Layer Security: Some basic reporting tools attempt to isolate tenant data by simply applying a visual filter on the frontend. This is a severe security risk, as tech-savvy users can easily bypass UI filters to query the backend database directly.
- Row-Level Security (RLS): True multi-tenancy enforces security at the query layer. Before a database query executes, the platform automatically appends tenant-specific attributes to the query, isolating the data before it ever leaves the database. Ensure your chosen platform supports robust, dynamic RLS to protect sensitive client information.
Custom Domains, SSO, and Full Branding Control
To achieve complete vendor invisibility, your platform must support advanced frontend customization:
- CNAME and Custom Domains: You should be able to map the portal to your own domain (e.g.,
portal.yourcompany.com) with automated SSL certificate provisioning. - Single Sign-On (SSO): Your clients should not have to manage a separate set of login credentials just to view their dashboards. Implementing SSO (via JWT, SAML, or OAuth) ensures that when a user logs into your main application or client portal, they are automatically authenticated into their dashboards.
- Granular CSS and Hex Matching: Look for platforms that allow you to customize the interface down to the pixel. This includes matching brand colors via hex codes, uploading custom favicons, customizing loading screens, and applying custom CSS to alter chart styles and layouts.
Comparing White Labeling to Traditional BI and iFrame Embedding
Many organizations make the mistake of trying to use traditional Business Intelligence (BI) tools for client-facing reporting. While legacy BI platforms are excellent for internal data analysis, they are notoriously difficult to adapt for external, white-labeled use cases.
To understand how to white-label major BI tools, read our specialized guides on White Label Power BI and White Label Tableau.
Here is how traditional BI, basic iFrame embedding, and modern white-label portals compare:
| Feature | Traditional BI Tools | Basic iFrame Embedding | Modern White Label Portals |
|---|---|---|---|
| Branding Control | Poor (heavy vendor branding, restricted UI customization) | Moderate (can hide some borders, but loading screens remain) | Excellent (100% vendor invisibility, custom CSS, custom domains) |
| Authentication | High friction (requires guest licenses or separate logins) | Medium friction (requires manual token generation) | Seamless (native SSO, JWT, and SAML integration) |
| Multi-Tenancy | Complex to set up; often requires duplicate reports per client | Difficult; requires complex backend proxy servers | Native (built-in row-level security and tenant isolation) |
| Pricing at Scale | Expensive (per-user or per-viewer licensing models) | Unpredictable (usage-based or query-based pricing) | Predictable (flat-rate platform fees or deployment-based pricing) |
| Setup Time | Months of development and data modeling | Days (but lacks depth and security) | Under an hour (with the right integration platform) |
The Hidden Costs of Building In-House vs. Buying
When faced with a reporting requirement, many engineering teams instinctively say, “We can build this ourselves in a few weeks.” This is a classic trap.
While building a basic chart is simple, building a production-grade, multi-tenant reporting system is incredibly resource-intensive. The 24-month Total Cost of Ownership (TCO) of building in-house typically includes:
- Initial Development: 4 to 6 Full-Time Engineers (FTEs) working for 12 to 18 months, costing between $1.4M and $2.6M.
- Ongoing Maintenance: 2 to 3 dedicated engineers required indefinitely to maintain data pipelines, update chart libraries, fix bugs, and build new connectors.
- Opportunity Cost: Every hour your core engineering team spends building a reporting engine is an hour they are not spending improving your core software product.
Buying a specialized white-label platform reduces your time-to-market from quarters to days, transforming a massive capital expense into a highly predictable operating cost.
Frequently Asked Questions about White Label Dashboards
What is the difference between white label reporting and embedded analytics?
White-label reporting is a branding model focused on complete vendor invisibility. It ensures that all client-facing assets—including interactive dashboards, static PDF reports, automated emails, and domain names—appear entirely under your own brand. Embedded analytics, on the other hand, is a delivery model that refers to placing charts and data visualizations inside an existing application, regardless of whether the third-party vendor’s branding is visible.
How does multi-tenant data isolation work?
Multi-tenant data isolation ensures that different clients can safely view their data within a shared dashboard architecture without any risk of data exposure. It works by enforcing Row-Level Security (RLS) at the query layer. When a client requests a dashboard, the system automatically appends their unique tenant ID to the database query, ensuring the database only returns records belonging to that specific client.
For more technical details on this architecture, read our breakdown of Embedded BI.
Can we integrate multiple BI tools under one white label portal?
Yes, but doing so natively is highly complex. Typically, if you use Tableau for one client and Power BI for another, you have to manage separate portals, authentication flows, and user permissions. However, using a unified embedding platform allows you to aggregate dashboards from multiple BI vendors (including Tableau, Power BI, QuickSight, and Metabase) into a single, cohesive client portal with a unified login, shared branding, and centralized row-level security.
Conclusion
Building a professional, secure, and fully branded analytics experience does not have to be an engineering nightmare or a multi-month project.
At Embedportal (proudly based in California, USA), we provide a white-label embedding platform designed to solve the exact challenges highlighted in this guide. Our unique platform enables SaaS teams and agencies to embed multi-vendor analytics—including Tableau, Power BI, QuickSight, and Metabase—under a single, unified brand identity.
With native row-level security, seamless SSO integration, and complete CNAME domain control, we help you launch a production-ready, secure client portal in under an hour.
Stop wasting valuable engineering hours building and maintaining custom reporting code. Deliver the polished, secure, and fully branded data experiences your clients expect while keeping your focus entirely on your core product.
Ready to see how simple white-labeling can be? Explore our Embedded BI Platform and launch your branded analytics portal today.