All About Embedded Reporting Benefits
Why Embedded Reporting Is Now a Core Product Requirement
Embedded reporting is the practice of integrating analytics, dashboards, and reports directly inside another application — so users never have to leave their workflow to find answers in their data.
Here’s a quick summary of what you need to know:
- What it is: Analytics built into your product, not bolted on as a separate tool
- How it works: Via APIs, SDKs, or iFrames that pull live data into your app’s UI
- Who it’s for: SaaS platforms, product teams, and any business that wants to give users data insights in context
- Why it matters: It drives higher user adoption, reduces churn, and creates new revenue opportunities through premium analytics tiers
For product and analytics leads at SaaS companies, the problem is familiar. Your customers want data. You have data. But getting that data in front of users — with the right branding, the right security model, and across multiple BI tools — is far harder than it sounds.
Context switching is a real cost. When users have to leave your product to find insights in a separate BI tool, they disengage. The workflow breaks. Trust in your platform erodes.
The business case is strong. Companies that have embedded analytics directly into their products report measurable gains — including a 60% surge in report usage in one marketing automation case study, and a 40% boost in user adoption in a healthcare analytics deployment.
This guide covers everything: how embedded reporting works technically, how to secure it across multiple tenants, how to white-label it properly, and how to avoid the mistakes that slow teams down.
What is Embedded Reporting and How Does It Work?
To truly understand what embedded reporting is, we have to look at how businesses traditionally shared data. In the dark ages of software, if a user wanted to analyze their performance, they had to export a massive CSV file, fire up a standalone business intelligence (BI) tool, and manually build their own charts.
This disconnected approach created a jarring user experience. Standalone reporting tools require separate logins, complex data pipelines, and constant context switching. It feels less like a smooth software experience and more like a chore.
By contrast, Embedded BI integrates these reporting components directly into the host application’s user interface. Instead of forcing users to leave your product to get answers, you bring the answers to them.
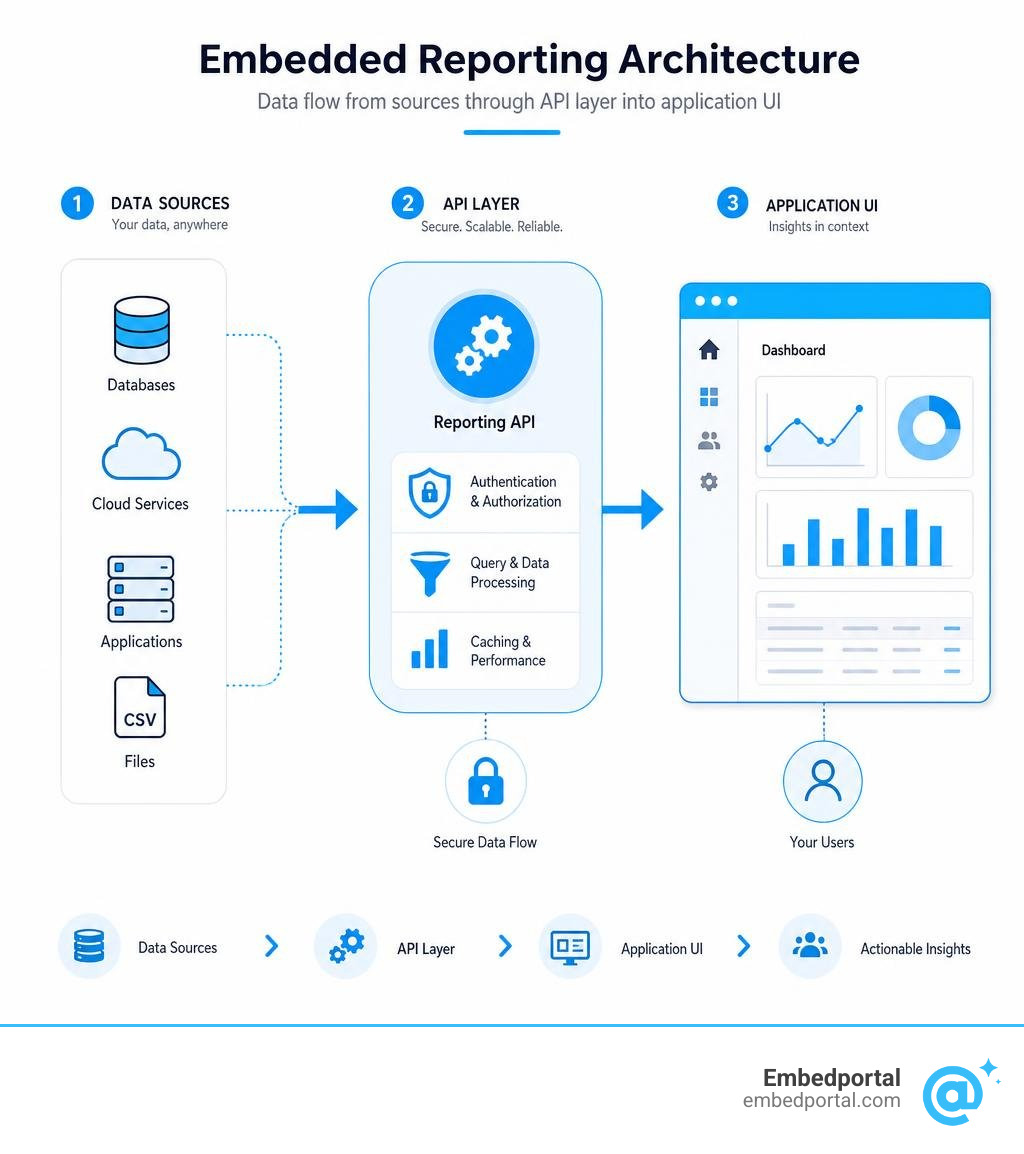
At its core, embedded reporting works by establishing a secure bridge between your application’s front end, your reporting engine, and your underlying data. When a user logs into your SaaS platform and navigates to their dashboard, the host application requests a secure session from the embedded analytics platform. This platform queries the relevant database, processes the visual elements, and renders them seamlessly within your application’s layout. The end user simply sees a beautifully integrated, interactive report that looks and feels like it was custom-built by your own engineering team.
Core Technical Components of Embedded Reporting
To pull off this seamless experience, several backend and frontend technologies must work together in perfect harmony:
- The Data Connectors: These are the pipelines that bridge your reporting engine to your databases, data warehouses, or APIs. Whether your data lives in PostgreSQL, MySQL, Snowflake, or real-time APIs, robust connectors ensure the reporting engine can fetch data without lagging.
- The Query Engine: This is the workhorse. It translates user interactions on the front end (like clicking a filter or changing a date range) into structured database queries. It executes these queries and formats the results for visualization.
- The Semantic Layer: Think of this as the universal translator. It maps complex database tables and raw columns into clear, user-friendly business terms (e.g., turning
tbl_usr_trans_v2.amt_usdinto “Net Revenue”). This layer is critical for enabling self-service reporting without exposing users to raw SQL.
iFrame vs. SDK Integration Methods
When it comes to embedding dashboards and reports, developers generally choose between two primary architectural paths: iFrames or Software Development Kits (SDKs).
An iFrame (Inline Frame) is an HTML element that loads another document inside the current page. It acts as a literal “window” to an external reporting server. It is incredibly quick to set up, requires very little code, and isolates the styles of the dashboard from your application’s CSS. However, iFrames are notoriously difficult to customize dynamically, and they can make deep interactivity (like triggering an application action from a dashboard click) a headache.
An SDK-based integration (often utilizing modern web components) provides a much tighter, code-first integration. By using JavaScript libraries and native web components, developers can control the look, feel, and behavior of the reports directly within the application’s codebase. This allows for deep interactivity, custom styling, and dynamic data filtering using secure, server-side tokens.
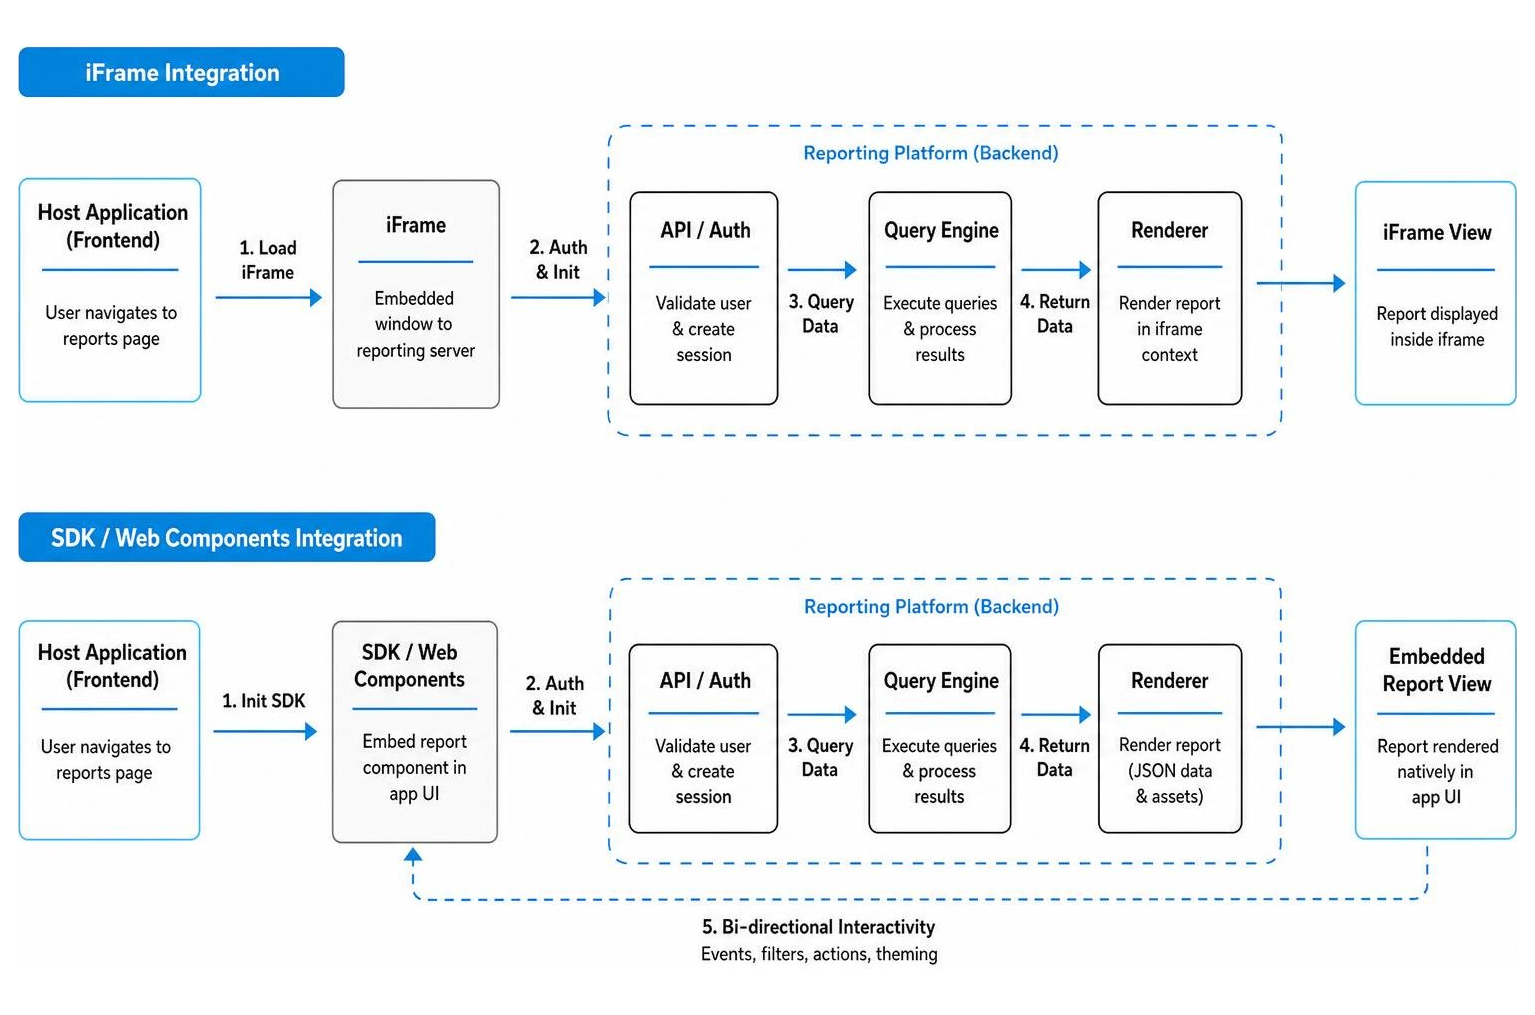
Here is a quick look at how these two methods stack up against each other:
| Feature | iFrame Integration | SDK / Web Components |
|---|---|---|
| Implementation Speed | Extremely fast (minutes) | Moderate (days to weeks) |
| Customization Depth | Limited to basic colors/sizing | Unlimited (CSS, custom layouts) |
| Interactivity | Low (isolated from host app) | High (bi-directional communication) |
| Security Handling | Simple URL parameters or tokens | Robust server-side token exchange |
| Performance | Can feel heavy or sluggish | Highly optimized and lightweight |
Key Benefits of Embedded Reporting for Modern SaaS
For SaaS providers in July 2026, offering basic grids of raw data is no longer enough. Modern software buyers expect rich, interactive, and actionable insights out of the box. Embedding a dedicated Embedded Analytics Platform into your application delivers three massive wins:
- Higher User Adoption and Retention: When users can answer their own questions inside your app, they use it more frequently. In fact, organizations that embed analytics into their products consistently report higher customer satisfaction scores and a significantly reduced rate of customer churn.
- Faster Time to Market: Building a production-grade reporting engine from scratch is a massive undertaking. It requires designing chart libraries, building export engines, managing query performance, and handling complex security. By buying an off-the-shelf embedding solution, SaaS platforms can launch customer-facing analytics up to 10 times faster than building in-house.
- Reduced Engineering Burden: Every hour your engineering team spends building custom charts for individual clients is an hour they aren’t spending on your core product value. Embedding a flexible reporting tool lets your developers focus on what they do best, while business users and clients get the reports they need.

Driving Revenue and Monetization with Embedded Reporting
Beyond keeping customers happy, Embedded Analytics for SaaS acts as a direct engine for business growth. Instead of treating reporting as a cost center, savvy product managers package analytics as a high-margin revenue generator.
You can monetize your embedded reporting in several ways:
- Tiered Feature Packaging: Offer basic, static reports in your standard plan, and gate interactive dashboards, ad-hoc report builders, and scheduled email exports behind your premium enterprise tiers.
- Dedicated Add-Ons: Charge a flat monthly fee or a per-seat license for advanced self-service analytics modules.
- Scheduled Snapshot Delivery: Use capabilities like Embedding Dashboards in Reports to generate automated, pixel-perfect PDF report snapshots delivered directly to your customers’ inboxes weekly or monthly. This keeps your brand top-of-mind and provides tangible value that customers are highly willing to pay for.
Empowering End-Users with Self-Service Analytics
The ultimate goal of modern embedded reporting is to turn your end-users into “insight creators.” Traditionally, if a business user needed a custom report, they had to file an IT support ticket and wait days (or weeks) for a developer to write a query and format a chart.
Modern embedded reporting changes this dynamic entirely. By embedding a web-based, drag-and-drop report designer directly into your application, you give non-technical users the keys to their own data. They can easily select fields, apply advanced filters, write custom formulas, and build interactive charts on their own. This self-service model dramatically reduces support tickets for your team and gives your customers the instant, real-time answers they need to run their businesses.
Multi-Tenant Security and White-Labeling Best Practices
When you are exposing data to external customers, security is not optional. You cannot afford a single instance of data leakage where Customer A accidentally sees Customer B’s metrics. This is why setting up secure, isolated Multi-Tenant Analytics is the most critical phase of any embedding project.
Implementing Robust Row-Level Security
To prevent data cross-contamination, you must enforce security at the server level, never on the client side. Relying on front-end CSS or JavaScript to hide sensitive data is a recipe for disaster — any user with basic browser developer tools can easily bypass those filters and access the raw data payload.
Instead, robust implementations rely on server-side Row Level Security. Here is how a secure token exchange process typically works:
- The user logs into your host application.
- Your application verifies their identity and determines their tenant ID and access permissions.
- Your server-side backend requests a secure, short-lived JSON Web Token (JWT) from the embedded reporting platform, passing the user’s tenant ID and role as secure claims.
- The reporting platform validates this token and automatically appends “forced filters” to every SQL query sent to the database (e.g., automatically appending
WHERE tenant_id = 'customer_abc'). - The database returns only the authorized rows, and the dashboard renders safely.
The Role of White-Labeling in User Adoption
If your embedded dashboards look like they were obviously built by a third-party vendor, it breaks the user experience and damages trust. To drive high adoption, your reports must feel like a natural, organic extension of your core software.
This is where White Label Analytics becomes essential. A true white-label implementation goes far beyond simply slapping your logo on a dashboard. It should allow you to:
- Apply custom CSS to match your exact brand typography, spacing, and button styles.
- Define custom color palettes so charts align perfectly with your product’s UI design system.
- Configure custom domains and remove all third-party watermarks or branding from the UI, URL paths, and PDF exports.
- Seamlessly integrate single sign-on (SSO) so users never have to log in twice.

Implementation Best Practices and Risks to Avoid
Deploying an embedded reporting solution is as much an operational challenge as it is a technical one. To ensure a smooth rollout, keep these best practices in mind:
- Plan for Data Quality Early: No matter how beautiful your charts are, if the underlying data is inaccurate, users will quickly lose trust. Establish clear data integration pipelines and run regular checks for data consistency before exposing reports to users.
- Optimize Query Performance: Users in 2026 expect instant gratification. If a dashboard takes 30 seconds to load because it is running unoptimized queries against a massive transactional database, adoption will crater. Use caching, pre-aggregated tables, or dedicated analytical data warehouses to keep load times under two seconds.
- Don’t Overcomplicate the Initial Launch: Start by identifying your users’ most common questions and build 3 to 5 highly polished, high-value dashboard templates. You can always expand into complex self-service builders later.
AI-Powered Insights and Automation
The cutting edge of embedded reporting in 2026 lies in AI and automation. Modern platforms are moving beyond static charts to offer agentic, natural language interfaces. This allows users to simply type questions like, “Show me our top-performing regions this quarter compared to last year,” and instantly receive a perfectly formatted chart.
Additionally, robust automated scheduling engines allow users to Generate Reports on a recurring basis. Whether it is tracking memory usage trends in a developer portal or emailing a weekly sales summary to an executive, automated delivery ensures that data finds the user, rather than forcing the user to hunt for the data.
Common Pitfalls and Deployment Risks
While the benefits are massive, there are several common pitfalls you must actively work to avoid:
- Report Fatigue: Just because you can build 50 different charts doesn’t mean you should. Flooding users with too many visual elements leads to cognitive overload. Focus on clear, actionable key performance indicators (KPIs).
- Failing to Anticipate Scale: A system that works perfectly for 5 tenants might buckle when you scale to 500. Ensure your embedding architecture supports automatic tenant provisioning and can scale database connections efficiently.
- Data Bleeding via Cached Results: If your reporting platform caches query results to improve performance, ensure the caching mechanism is tenant-aware. Otherwise, a cached query from Tenant A might accidentally be served to Tenant B.
Frequently Asked Questions about Embedded Reporting
How do you choose the right embedded reporting tool?
Choosing the right tool depends heavily on your existing tech stack, developer resources, and budget. If your product relies on existing corporate BI standards, you might look into Tableau Embed or Power BI Embedding to leverage your team’s current dashboard designs. If you are developing within a specific framework like .NET, you might evaluate specialized developer libraries designed for your environment.
Always evaluate a vendor’s multi-tenant security model, their API and SDK depth, their white-labeling capabilities, and whether their pricing model scales gracefully as your user base grows.
What is the difference between workspace-per-tenant and shared schema isolation?
In a workspace-per-tenant architecture, each of your customers gets their own completely isolated environment within the BI platform. This offers incredibly strong security boundaries but comes with a higher administrative overhead when deploying updates.
In a shared schema architecture, all customer data lives in a single, unified database table, and row-level security (RLS) is applied at query time to filter the data. This is much easier to maintain and scale but requires meticulous server-side security configuration to prevent data leaks.
How does embedded reporting support regulatory compliance?
In heavily regulated industries, data security and structured reporting are legal mandates. For instance, organizations operating in California must navigate strict data privacy laws (like CCPA/CPRA) as well as complex state-level reporting requirements — ranging from the Covered Battery-Embedded (CBE) Waste Recycling Fee – CDTFA to emerging climate disclosure rules where groups like XBRL US urges structured digital reporting in California climate rules.
Embedded reporting platforms support compliance by providing granular audit logs, enforcing strict role-based access controls, and ensuring data encryption both in transit and at rest. This makes it easy to prove exactly who accessed what data, and when.
Conclusion
As we navigate the software landscape of July 2026, user expectations are clear: they want native, secure, and beautiful analytics built directly into the software they use every day. Building these capabilities from scratch is a costly, time-consuming distraction from your core product roadmap.
At Embedportal, we solve this exact headache. Our white-label embedding platform allows you to embed multi-vendor analytics — including Tableau, Power BI, QuickSight, and Metabase — into your application with unified branding, robust row-level security, and seamless SSO integration in under an hour.
Ready to turn your users into insight creators without derailing your engineering roadmap? Explore our Embedded Analytics platform today and see how easy customer-facing reporting can be.