
Searching for white label tableau usually means you are not actually shopping for charts. You are trying to ship customer-facing analytics that look like part of your product, live inside your auth flow, and do not send users into somebody else’s world. That is exactly where the easy demo ends and the real evaluation begins.
What “White-Label Tableau” Usually Means in Real Life
Most teams use “white-label Tableau” as shorthand for “can you make Tableau feel native inside your app?” That is a fair question, but the phrase hides a lot. A basic embed is one thing. A branded embed is another. A true white-label experience is a much stricter bar.
In practice, white-label means your customer should not notice a seam. No surprise vendor URLs. No off-brand login screen. No export with somebody else’s name in the footer. No navigation that suddenly feels like a separate product. If the analytics area feels like a guest living in your spare room, it is embedded. If it feels like it was built with the rest of your product, that is white-label.
Embedded, OEM, and White-Label Aren’t the Same Thing
These terms overlap, which is why buying conversations get messy fast.
Embedded analytics means dashboards or reports appear inside another product. OEM BI usually means a vendor licenses analytics technology for use inside a commercial application. White-label analytics goes one step further and focuses on the experience being fully rebranded and tightly controlled.
That difference matters. An OEM license might let you embed dashboards, but still leave limits around tenancy, URLs, login flows, or visible product chrome. A white-label platform should give deeper control over the whole surface area, not just a color picker and a place to upload your logo.
Where Tableau Fits and Where the Catch Is
Tableau absolutely supports embedded analytics. It has a mature visualization engine, strong authoring, and a lot of existing enterprise trust. If your team already runs on Tableau, that familiarity counts for something.
The catch is that standard Tableau embedding is often only a partial answer to a white-label requirement. Research on true white label analytics keeps coming back to the same point: a logo swap is not enough when vendor navigation, UI conventions, or external domains still peek through. Tableau can power the dashboards, but the surrounding experience often needs extra infrastructure, extra design work, and extra patience.

Start With the End State You Actually Need
A long feature checklist feels productive, but it can send you straight into the weeds. Start with the finished experience you need to deliver.
An internal analytics portal has very different constraints from a SaaS product module used by thousands of customer accounts. An agency client portal cares deeply about branded exports and margin. An internal data platform team might care more about putting a single experience in front of dashboards from several tools. Same category, different buying logic.
Questions That Make the Shortlist Smarter
Get specific before you compare vendors. Who will see the analytics? Internal teams, external customers, or both? How many users could this reach if adoption actually goes well? Do tenants need isolated data models, or is row-based filtering enough? Do users need to sign in with your existing identity provider? Does the analytics layer need to live on your own domain?
That last one gets ignored until late in the process, then suddenly becomes a deal-breaker. If your product lives at app.yourcompany.com and analytics jumps to a vendor URL, your users notice. Agencies notice even faster. One client sees a third-party URL in the browser bar during a quarterly review and the illusion is gone.
If You Need “Indistinguishable From Your Product,” Say That Up Front
This requirement changes the whole list. Not a little. Completely.
If your goal is an experience that feels native, not “good enough for an iframe,” you need to say that from day one. Otherwise, you will spend two weeks watching polished demos that solve the wrong problem. The right benchmark is simple: can somebody land in the analytics area and reasonably assume your product team built it?
If that is the target, it helps to frame your search around customer-facing analytics inside SaaS products, not just generic BI embedding. That shifts the evaluation toward auth, tenancy, UI control, and lifecycle management instead of dashboard authoring alone.
Evaluate Branding Depth, Not Just Theme Settings
Branding is one of the biggest traps in this category because every vendor can make screenshots look pretty. What matters is the full experience around those screenshots.
A real white-label setup covers everything a user touches before, during, and after opening a dashboard. Theme settings are the easy part. The ugly surprises live elsewhere.
Brand Removal, Navigation Control, and Custom Domain
Start with the basics. Can you remove vendor branding everywhere, not just in the chart area? Can you suppress third-party navigation? Can you control headers, menus, tabs, and surrounding layout? Can the experience run on your domain or subdomain, such as analytics.yourproduct.com?
This is not cosmetic nitpicking. Custom domain support is one of the cleanest dividing lines between partial embedding and deeper white-label control. Several market guides note that custom domain support is rare in standard embedded BI setups and common in purpose-built white-label platforms.
Login Pages, Emails, Exports, and Shared Links
Here is where many teams get burned. The dashboard itself looks fine, then implementation starts and somebody notices the password reset email still comes from the vendor. Or scheduled reports carry the wrong branding. Or PDF exports reveal the underlying platform. Or share links point to a vendor hostname.
Those details matter because users experience analytics as a journey, not a single screen. For agency portals, branded PDFs and emails are often just as important as the dashboard UI itself. For SaaS products, those surfaces affect trust. Nobody wants an enterprise customer forwarding an exported report with somebody else’s branding still attached.
Styling Flexibility Without Fragile Workarounds
Ask how styling really works. Can you control fonts, spacing, filters, buttons, tooltips, and empty states through supported configuration, or are you expected to layer custom CSS on top and hope the next update does not break anything?
There is a world of difference between supported customization and “you can probably hack it.” A brittle wrapper can survive a demo and collapse during a routine platform upgrade. If your design system is strict, test exact components early, not just general appearance.
Check Multi-Tenancy and Data Isolation Before Anything Else
https://www.youtube.com/watch?v=AWRWG831Q1w
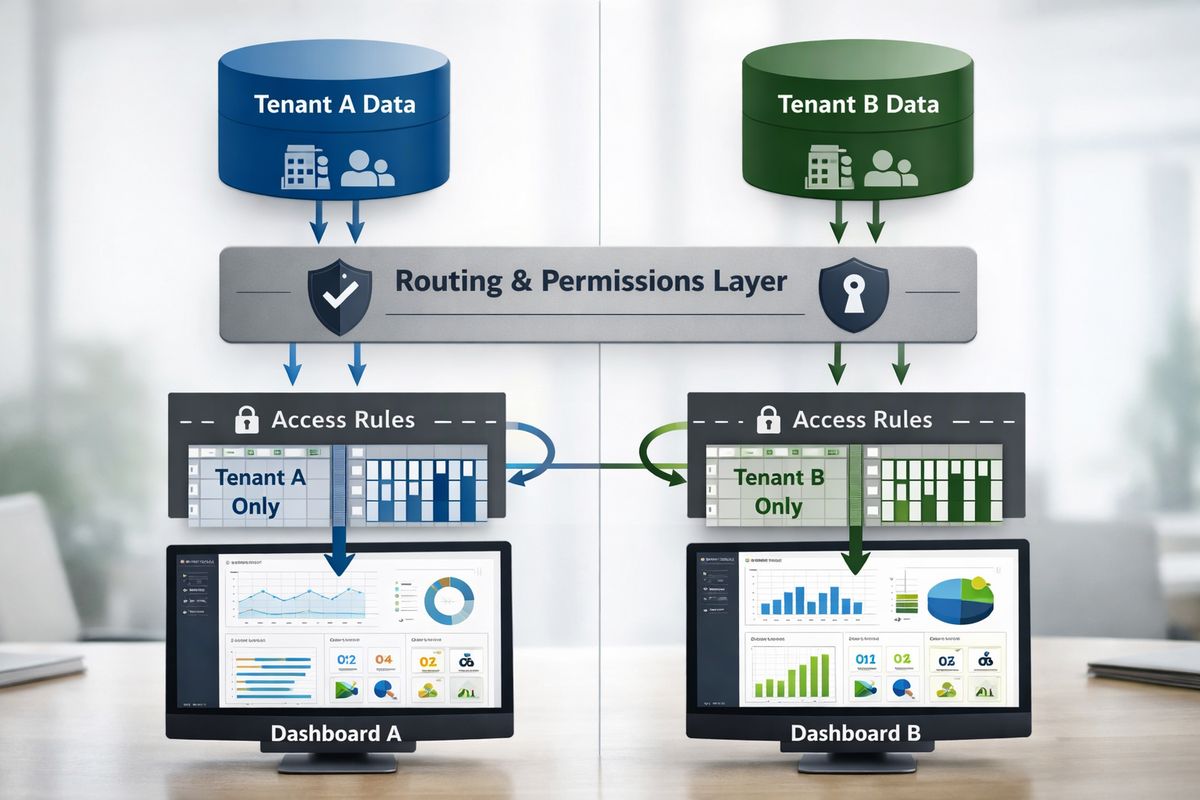
For B2B SaaS and agencies, tenancy is the real exam. Anybody can show a clean dashboard for one sample customer. Production is about keeping account A from ever seeing account B’s data, even by accident, even under weird edge cases, even on a rushed Monday morning.
If your use case involves many customer accounts, move this section to the top of your buying scorecard. It matters more than half the visual features you will hear about.
Row-Level Security vs Database-Per-Tenant
Most setups land in one of two camps. Row-level security means many tenants share a data store, but access rules filter what each user can see. Database-per-tenant means each customer has separate data storage, with routing logic deciding where queries go.
Row-level security is usually easier to operate at scale, but it puts more pressure on policy design and testing. Separate databases can offer stronger isolation and easier customer-specific scaling, though the overhead rises fast. If you are sorting through Tableau-specific options, it helps to understand how tenant-aware access rules behave in Tableau before you assume the model is plug-and-play.
Tenant Provisioning, User Mapping, and Access Rules
RLS alone is not the whole story. You also need to know how users get mapped to customer accounts, how roles are assigned, how new tenants are provisioned, and how changes get updated when accounts merge or permissions shift.
This is the boring plumbing that makes or breaks supportability. If onboarding a new customer requires manual workbook edits, custom scripts, and a prayer, that cost will follow you forever. Look for a clean model for tenant metadata, user-role mapping, and automated provisioning.
What to Ask for in a Proof of Concept
A proof of concept should mimic the ticket your support team dreads, not the story a sales engineer loves. Ask to test at least two or three tenants with overlapping account names, different roles, and edge-case filters. Try impersonation if supported. Test what happens when entitlements change mid-session. Check exports, not just live views.
A useful POC feels a little annoying. That is the point.
Security, SSO, and Compliance Need a Production-Level Review
Security for embedded analytics is not paperwork you save for procurement. In a customer-facing rollout, auth and access design shape the whole implementation.
This usually starts with token-based embedding and quickly expands into identity, session behavior, auditability, and deployment control.
JWT Signing, Embed Tokens, and Session Control
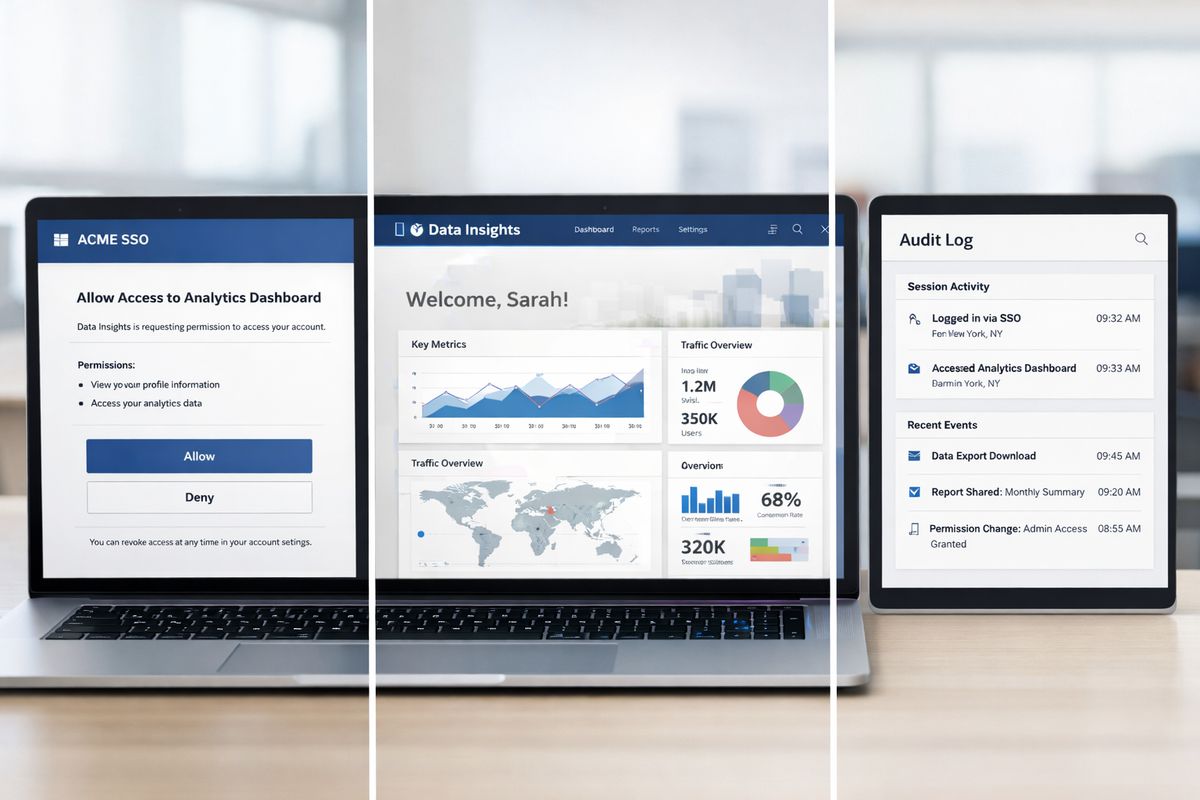
JWTs and embed tokens are just signed claims about who the user is and what access is allowed. Simple idea, but the details matter. How long do tokens live? Can you revoke sessions early? How do you prevent replay? What happens if user permissions change after token issuance?
You want clear answers here, not vague assurance. A production-grade setup should define token expiration, refresh patterns, signing key management, and session boundaries. If the platform supports embedding but gives weak control over session behavior, you will end up compensating in your app layer.
SSO, Identity Providers, and User Experience
SSO should feel invisible to users. If somebody signs into your app and then hits a second login screen inside analytics, the experience already lost.
Check support for SAML, OAuth, and OpenID Connect with your identity provider. Then go one step further and test the actual flow. Does deep-linking work? Do users land in the right tenant context? Does logout behave cleanly? Can service accounts or delegated access be handled without weird exceptions?
Regulated Environments: Healthcare, Finance, and Private Deployment
In regulated settings, the flashy features stop mattering very quickly. Deployment model, encryption, auditability, and direct data connectivity become the real shortlist filters.
Healthcare is a good example. With healthcare breaches topping $7 million per incident on average in cited research, you cannot treat PHI exposure as an afterthought. If your customers require private cloud, on-premise deployment, or strict audit controls, verify that before a design review gets attached to the vendor. Tableau can be attractive here because self-hosted deployment remains an option, but tenant isolation and external-user ergonomics still need close review.
The Embedding Layer Is Where Buy vs Build Gets Real
Here is the part buyers often underestimate: the dashboard engine is only one layer of the job. The harder work often sits around it.
You still need the host-page experience, auth handoff, role mapping, tenant lifecycle, support tooling, observability, and branded flows around exports and notifications. That surrounding layer is where projects quietly become six-month detours.
What You Still Need to Build Around Tableau
Even if Tableau handles visualization well, you may still need to build a lot of glue. That can include tenant-aware authentication, embed orchestration, branded wrappers, navigation controls, provisioning jobs, error handling, usage tracking, and internal admin tools for support teams.
None of that is glamorous. All of it becomes product surface area the moment customers touch analytics.
Time, Team Load, and Ongoing Maintenance
This is where buy versus build stops being abstract finance language and turns into roadmap math. Research on white-label deployments regularly puts in-house analytics builds at 6 to 18 months, with 20% to 30% of engineering capacity tied up in ongoing maintenance. That sounds dramatic until you start listing the moving parts.
If your team is already stretched, embedding a BI tool and wrapping the missing pieces yourself can act like a second product line. Every auth update, data model change, and UI refresh now touches analytics too.
When Purpose-Built White-Label Platforms Win
Purpose-built embedded analytics platforms often pull ahead when your priorities are full brand control, multi-tenant external scale, and less custom infrastructure to babysit. That is especially true if your product analytics needs to feel native and customer-safe from day one.
This is also why pricing and architecture discussions around multi-account analytics delivery tend to surface early with embedded products built for SaaS, while they can feel bolted on in tools designed mainly for internal BI.
Pricing Can Break the Business Case Faster Than Missing Features
A tool can pass every feature check and still fail financially once real usage arrives. This happens all the time.
Internal BI pricing models often behave badly when analytics moves into a product and suddenly needs to serve hundreds or thousands of external users.
Per-Seat, Per-Viewer, Usage-Based, and Flat Models
Per-seat and per-viewer pricing can work for internal employees. In a SaaS product, those models can get painful fast. Tableau is often flagged for this because its viewer-style economics can become expensive at scale when analytics is exposed broadly.
Usage-based pricing can be better if engagement is predictable, but it can also punish success. Flat or pooled models are often easier to plan around when customer adoption is part of the value story. If pricing is still fuzzy, it helps to compare it against the broader patterns in embedded analytics cost models before committing to a licensing path.
Hidden Costs Beyond the License
The sticker price is only the start. Add implementation services, premium embedding tiers, support plans, export volume, hosting, monitoring, and the engineering hours needed to bridge product gaps.
This is where a “cheaper” option suddenly costs more. A platform that demands months of wrapper work, auth plumbing, and support tooling is not really cheaper, it just moved the bill into your roadmap.
Budgeting by Use Case
If you run a SaaS product, prioritize pricing that scales with external adoption without punishing every new customer user. If you run an agency, margin matters, and branded reporting has to stay profitable across many clients. If you own an internal platform, the value may come from consolidating multiple BI tools behind one experience.
Different use cases need different math. Treating all three the same is how business cases fall apart.
AI and the Semantic Layer Are Now Part of the Evaluation
AI is now in every demo, which is both useful and a little exhausting. The question is not whether a vendor has a chat box. The question is whether the answers can be trusted.
That comes down to governance more than clever wording.
Ask Whether the AI Is Useful or Just Attached
Natural-language querying, copilots, anomaly detection, and generated narrative can be genuinely helpful. But if the AI sits directly on raw SQL or inconsistent workbook logic, it can sound confident while returning nonsense.
A better test is simple: are the answers grounded in governed definitions, security rules, and tenant context? Some current guides on AI-enabled white label analytics make this point directly. Without semantic grounding, AI becomes a fast path to bad answers.
Why a Semantic Layer Matters for Embedded Analytics
A semantic layer is the governed place where metrics and business logic live. Plain English version: it is where “monthly recurring revenue” means one thing everywhere, instead of five slightly different things depending on which dashboard somebody opened.
For embedded analytics, that matters twice. It keeps dashboard outputs consistent across tenants, and it gives AI something reliable to stand on. If your analytics product will power executive decisions or customer conversations, consistency beats novelty every time.
Common Mistakes That Turn “White-Label” Into a Mess
Most failed evaluations do not fail because the charts are ugly. They fail because a team assumed a slick demo meant production readiness.
A few mistakes show up again and again.
Confusing a Nice Demo With a Native Product Experience
A polished embed can still fall apart on URLs, mobile layout, shared links, exports, login transitions, or permission edge cases. The dashboard itself is only one frame in a longer movie.
If the demo never covers those other surfaces, assume the hard part is still hidden.
Underestimating External User Scale
A pricing model that feels fine for 50 internal users can become awful for 5,000 customer users. Same problem with auth assumptions, provisioning flows, and support operations.
Plan for the version of your product that works, not the one still in pilot. Success should not break your analytics model.
Leaving Security and Tenant Testing Until Procurement
This is one of the most expensive mistakes because it wastes calendar time. Security, SSO, RLS, and deployment review should happen early. Not after legal redlines. Not after design sign-off. Early.
Those requirements regularly eliminate options that looked great in week one.
Best Fit by Scenario: When Tableau Works and When to Look Beyond It
Tableau is not the wrong answer by default. It is the wrong answer for certain end states.
If you match the tool to the job honestly, the choice gets much easier.
Tableau Can Work Well If Your Priority Is Familiar BI and Light Embedding
Tableau makes sense when you already have a strong Tableau footprint, your team knows the ecosystem, and your embedding needs are relatively light. It also fits when the analytics area can tolerate some separation from the host product and your users care more about proven BI capabilities than pixel-perfect product immersion.
This is common in partner portals, internal-facing external access, and situations where branded embedding is enough even if full white-label is not.
Look Beyond Tableau If You Need Deep White-Label Control
If you need full brand removal, custom domain support, native-feeling UX, scalable multi-tenant external delivery, and lower engineering lift around auth and lifecycle plumbing, you probably need a different class of platform.
That is not a knock on Tableau’s strengths. It is just acknowledging that analyst-first BI tools and product-native analytics platforms solve different problems. If “indistinguishable from your app” is the requirement, say it plainly and screen options against that bar.
A Simple Evaluation Checklist to Use This Week
Use a short list and make vendors prove it. Test branding depth, custom domain support, token auth, SSO behavior, tenant isolation, pricing at external-user scale, deployment flexibility, and semantic-layer support.
Then try one realistic flow: sign in through your product, land in the right tenant, open a dashboard, export a PDF, share a link, and switch permissions mid-session. If that single path feels smooth, you are looking at something real. If it feels patched together, that is your answer.
Frequently Asked Questions
Is Tableau truly white-label?
Not by default in the strict sense. Tableau can be embedded and branded, but full white-label usually means complete vendor-brand removal, custom domain control, and tight control over surrounding UX. That often requires extra work outside Tableau itself.
Can you use Tableau for a SaaS customer portal?
Yes, but the fit depends on how native the experience needs to feel. If light embedding is acceptable, Tableau can work well. If your portal needs to feel fully integrated with your product, tenancy, auth, and branding details need much closer scrutiny.
What matters more than dashboard appearance in a white-label Tableau evaluation?
Multi-tenancy, auth flow, pricing at scale, and branding across the whole journey. A nice-looking dashboard does not help if exports expose the vendor, SSO is clunky, or pricing explodes as customer adoption grows.
Does Tableau support row-level security for embedded use cases?
Yes, Tableau supports row-level security, and it can be used for embedded scenarios. The real question is how maintainable the access model will be as tenants, roles, and edge cases grow over time.
Is per-user pricing a problem for customer-facing analytics?
It can be. Per-user or per-viewer licensing often works better for internal BI than for customer-facing products with large external audiences. Always model pricing against your adoption scenario, not just your pilot.
Should AI features influence the decision?
Yes, but only if the AI is grounded in governed metrics and tenant-aware access controls. A chat feature without a reliable semantic layer is more marketing than product.