How to Embed Tableau in Simple Steps
What Tableau Embedding Is — and Why It’s Harder Than It Looks
Tableau embedding lets you display interactive Tableau dashboards and views directly inside a web page, portal, or application — without sending users to a separate Tableau environment.
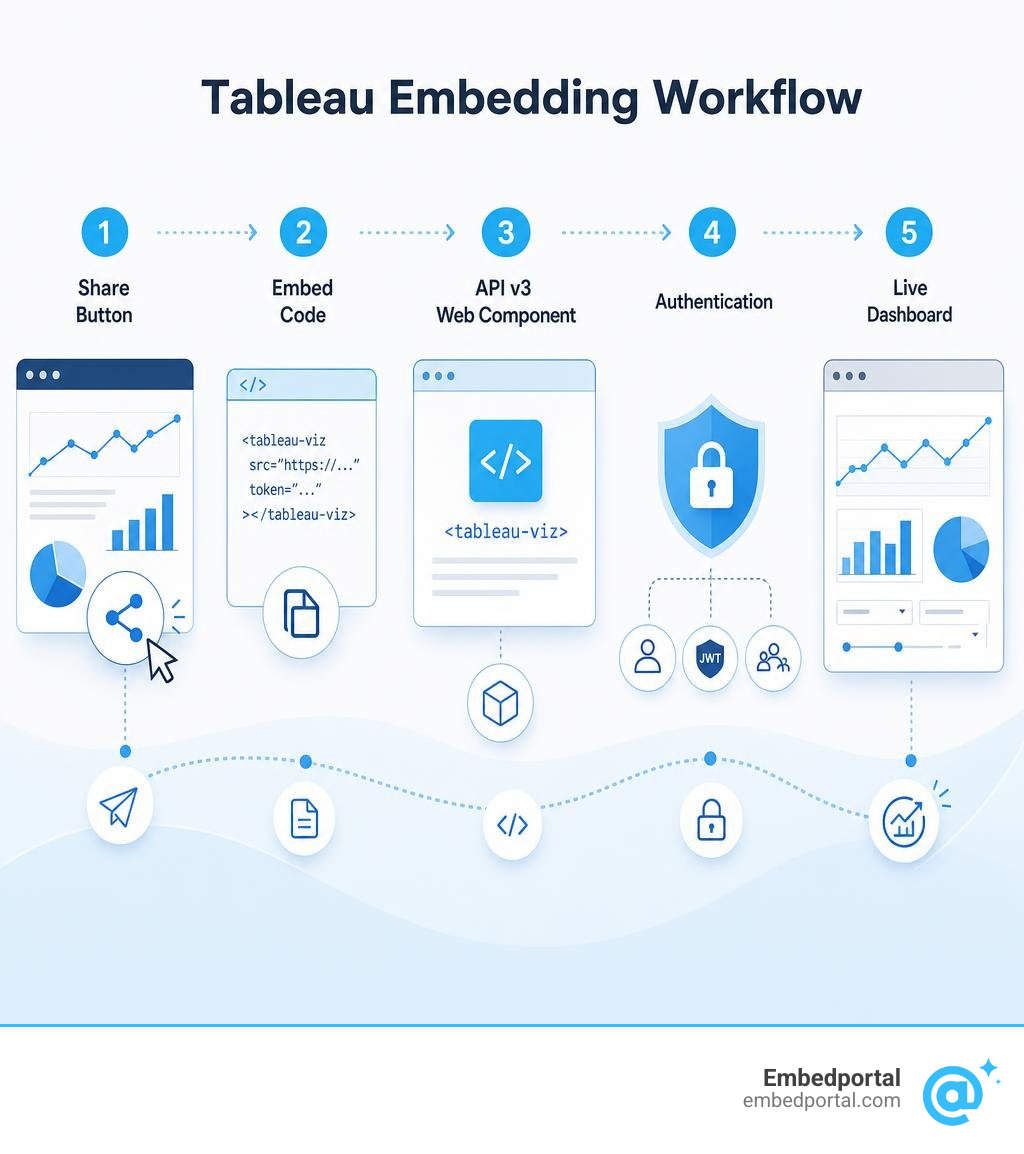
Here’s a quick summary of how it works:
- Get the embed code or use the API — Copy the embed code from Tableau’s Share button, or use the Embedding API v3 for full programmatic control.
- Add a web component to your HTML — The
- Configure authentication — Users need permission to see the content, either through a Tableau login, Connected Apps with JWT tokens, or a Guest account.
- Customize and interact — Control filters, tabs, toolbar options, and respond to user actions like mark selections using JavaScript.
That’s the short version. But if you’re an analytics or product lead trying to embed Tableau dashboards into a branded customer portal — especially alongside other BI tools — the real complexity starts fast.
Authentication needs to work seamlessly. Row-level security has to match your tenant model. Branding needs to feel native, not bolted on. And every new embedded tool adds another layer of fragmentation to maintain.
Tableau’s own Embedding API has evolved significantly. Starting with Tableau 2021.4, the new Embedding API v3 replaced the older JavaScript API approach with a cleaner, web-component-based model. And since Tableau Server 2022.3 and Tableau Cloud, API v3 is the default — meaning the old embed code you may have used before no longer applies.
This guide walks through exactly how to embed Tableau step by step, covers authentication and security, and is honest about where Tableau embedding gets expensive or complicated at scale.
What is Tableau Embedded Analytics and How Does It Work?
At its core, Tableau Embedded Analytics is the practice of integrating Tableau’s powerful, interactive data visualizations directly into external-facing applications, customer portals, internal wikis, or simple web pages. Instead of forcing your users, partners, or customers to log into a separate Tableau Server or Tableau Cloud instance, you bring the charts, maps, and filters directly to them.
But how does it actually work behind the scenes? When a user loads a webpage containing an embedded Tableau view, their browser downloads the Tableau Embedding API library. This library communicates with your Tableau Server, Tableau Cloud, or Tableau Public instance to fetch the requested workbook. The visualization is then rendered dynamically inside the user’s browser, maintaining all of its interactive capabilities.
One of the greatest benefits of this approach is that these embedded views update automatically. Whenever your underlying data source refreshes or a developer publishes an update to the workbook in Tableau Desktop, those changes are immediately reflected in your embedded portal without requiring any code updates.
While this sounds straightforward, delivering a seamless experience requires managing several moving parts. You must ensure that the user is authenticated securely, that they only see the data they are authorized to access, and that the dashboard’s visual style aligns with your application.
For organizations that want to avoid building these complex authentication, design, and integration layers from scratch, using an Embedded Analytics Platform can save months of engineering effort. These platforms act as a unified orchestration layer, allowing you to deliver polished analytics experiences with minimal custom development. To explore the broader possibilities of this technology, check out the official Tableau Embedded Analytics page.
The Evolution of Tableau APIs: API v2 vs. Embedding API v3
If you have worked with Tableau in the past, you are likely familiar with the legacy JavaScript API (v1 and v2). However, starting with Tableau 2021.4, Tableau introduced a completely re-engineered developer experience: the Tableau Embedding API v3. This modern version is now the default standard for all new deployments, especially on Tableau Server 2022.3+ and Tableau Cloud.
Understanding how the legacy and modern APIs differ is crucial for planning your implementation or migrating older code.
- Initialization Method: In API v2, you had to write complex JavaScript setup code to instantiate a constructor and target a specific container element. In API v3, you can use a modern web component, the
- Code Structure: API v2 relied on traditional, monolithic JavaScript files. API v3 is built using ES6 modules, allowing you to import only the specific classes and event models you need.
- Web Standards: API v2 relied on custom iframe logic that was difficult to style or control. API v3 leverages modern web components, custom elements, and the Shadow DOM, aligning perfectly with modern frontend frameworks like React, Angular, and Vue.
- Maintenance & Updates: Legacy code required manual updates whenever server endpoints changed. API v3 is designed to be backward-compatible and actively updated via Tableau’s modern CDN.
Modernizing Your Workflows with Tableau Embedding API v3
The shift to the
Because the component leverages the Shadow DOM, the internal styling and scripts of the Tableau dashboard are isolated from your parent application. This prevents CSS conflicts, ensuring that your application’s styles do not accidentally break the dashboard layout, and vice versa.
For developers tasked with creating a seamless customer experience, this isolation is a critical first step toward achieving a White Label Tableau experience. By wrapping the web component in your own custom interface, you can hide the default Tableau styling and present a unified, branded portal to your end-users.
How to Embed Tableau in 4 Simple Steps
Embedding a Tableau dashboard using the modern API is incredibly straightforward. By combining semantic HTML with a touch of JavaScript, you can have a live, interactive visualization running in your application in minutes.
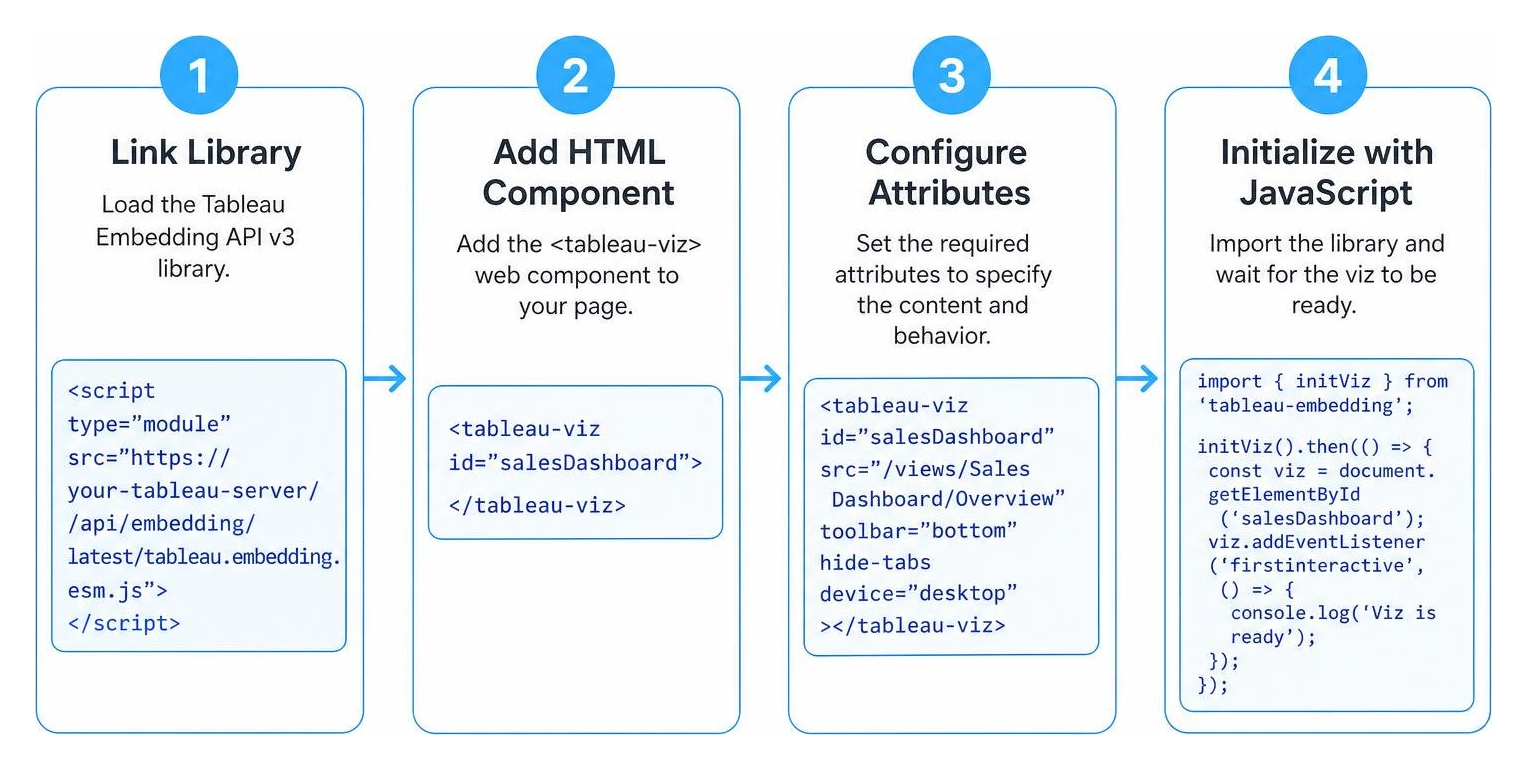
This section walks through the core steps, utilizing concepts found in the official Embedding API v3 Tutorial.
Step 1: Link to the Tableau Library
Before your webpage can understand the custom
To load the library, add a script tag to the head or body of your HTML document. You must set the type attribute of this script tag to “module” because the modern library is distributed as an ES6 module. For example, your script tag’s src attribute will point to a URL ending in “tableau.embedding.3.latest.min.js” hosted on your Tableau instance or Tableau’s public CDN.
Step 2: Add the Web Component to Your HTML
Once the library is linked, you can drop the
The most critical attribute to include on this tag is the “src” attribute. The value of this attribute must be the exact URL of the Tableau view you wish to display. Ensure that this URL begins with HTTPS, as modern browsers and Tableau security policies restrict embedding over unencrypted HTTP connections.
Step 3: Configure Attributes for Customization
The
To control these settings, you can add attributes directly to the element:
- toolbar: Set this to “hidden” to completely hide the bottom Tableau toolbar, or leave it default to display options like export and revert.
- hide-tabs: Add this boolean attribute if your workbook contains multiple sheets but you want to hide the standard top tab navigation.
- device: Specify whether to force a “desktop”, “tablet”, or “phone” layout, helping you optimize the dashboard for different screen sizes.
For a deeper look at manual parameters and legacy fallback structures, refer to the guide on Writing Embed Code for Views – Tableau.
Step 4: Initialize and Interact Using JavaScript
While basic embedding can be done entirely in HTML, you will often want to programmatically control or respond to the dashboard. To do this, you can use JavaScript to target the TableauViz object.
First, use standard DOM methods like document.querySelector or document.getElementById to select your
Using modern JavaScript promises and async/await syntax, you can then call methods on the visualization, such as switching sheets or applying filters dynamically based on actions your user takes elsewhere in your portal. For detailed examples of these programmatic controls, consult the documentation on how to Interact with the View.
Advanced Customization and Security in Tableau Embedding
Once you have mastered the basics of displaying a dashboard, the next challenge is securing the data and creating a deeply integrated user experience. When embedding dashboards for external customers, security is not optional — you must ensure that User A cannot see User B’s data under any circumstances.

Implementing these advanced features requires combining robust authentication protocols with Tableau’s interactive API models, as detailed in the Tableau Embedded Analytics Playbook.
Authentication and Security Best Practices for Tableau Embedding
To provide a seamless user experience, you must implement Single Sign-On (SSO) so that users do not have to log in to Tableau separately after signing into your application.
The modern standard for securing embedded Tableau content is Tableau Connected Apps, introduced in version 2021.4. This framework allows you to establish a trusted relationship between your application server and Tableau Server or Tableau Cloud.
When a user requests a page, your backend server dynamically generates a JSON Web Token (JWT). This token is signed using a secret key shared with Tableau and contains claims such as the user’s username, session expiration, and specific access scopes (such as “tableau:views:embed”). You then pass this JWT directly to the
To ensure your environment remains secure, we recommend several best practices:
- Enforce Domain Allowlists: Configure your Tableau site settings to restrict embedding to specific, trusted domains. This prevents malicious actors from trying to embed your dashboards on unauthorized websites.
- Dynamic Token Generation: Never hardcode or reuse JWTs. Always generate a unique token with a short lifespan (e.g., 5-10 minutes) on your backend for each user session.
- Secure Sign-Out: In shared device environments, ensure that when a user logs out of your portal, you programmatically call the Tableau REST API sign-out endpoint to clear active session cookies.
For a comprehensive guide on setting up these trusted relationships, read the official Authentication and Embedding documentation.
To ensure that users only see the specific rows of data they are allowed to see, you must also set up robust data filtering. Implementing Row Level Security Tableau allows you to map user attributes passed in your JWT directly to data filters inside your workbook, ensuring perfect multi-tenant data isolation.
Advanced Customization: Filters, Marks, and Event Listeners
With the modern Embedding API v3, you can build two-way communication between your parent application and the embedded dashboard. This allows you to build custom HTML buttons, dropdowns, or sidebars that drive the visualization, or have your application react when a user clicks on a chart.
- Programmatic Filtering: You can use the “applyFilterAsync” method on the active sheet object to change dashboard filters dynamically. This is perfect for building a unified search or filtering bar that controls both your application content and your Tableau reports simultaneously.
- Mark Selection: Use “selectMarksByValueAsync” to highlight specific data points programmatically, drawing the user’s attention to key anomalies or trends.
- Listening to User Actions: By adding an event listener for the “MarkSelectionChanged” event, your application can detect when a user clicks a specific bar, map region, or scatter plot point. You can capture this data and use it to update other parts of your application, such as loading a customer profile or displaying a detailed contextual menu.
Limitations of Tableau Embedded Analytics
While Tableau is an industry leader in complex, exploratory data visualization, using it as an embedded solution for custom applications comes with significant challenges. As you scale your application, you may encounter roadblocks that impact your budget, user experience, and development timeline.
- High Cost & Pricing Predictability: Tableau’s pricing model is primarily designed for internal enterprise deployments. When embedding for external customers, buying individual Viewer licenses for hundreds or thousands of users quickly becomes cost-prohibitive. While Tableau offers consumption-based pricing using “impressions” for external use cases, navigating these contracts can be complex and expensive. To understand how these costs compare to other options, check out our analysis of Embedded Analytics Pricing.
- Customization & Integration Complexity: While the Embedding API v3 provides solid control, achieving a true white-label experience is incredibly difficult. The dashboard is still rendered inside an iframe, which limits your ability to customize fonts, colors, and interactive elements using standard CSS. If your product team demands a seamless, native-feeling UI, working around these limitations requires significant custom engineering.
- Performance with Large Datasets: Because Tableau dashboards rely on rendering complex visualization layers, embedded views can experience slow load times when dealing with massive datasets or complex dashboard designs. This latency can negatively impact the user experience of your SaaS product.
- Lack of Self-Service Report Building: Tableau Embedded Analytics is excellent for displaying pre-built dashboards, but it lacks robust, lightweight self-service report-building tools for your end-users. If your customers want to build their own custom charts or easily modify existing views inside your app, they are often forced into a complex web-authoring interface that is too overwhelming for the average user.
If these limitations align with challenges your team is currently facing, it may be worth exploring the Best Embedded Analytics Tools to find a solution that offers more flexible pricing, deeper white-labeling, and faster implementation times.
Frequently Asked Questions
How do I handle authentication errors in embedded views?
When embedding Tableau dashboards, authentication failures can occur due to expired tokens, incorrect JWT configurations, or browser security settings.
To handle these gracefully, you can add an event listener for the “VizLoadError” event on your web component. When an error is captured, your JavaScript can inspect the error code and take appropriate action, such as requesting a fresh JWT from your backend or displaying a user-friendly message.
Additionally, ensure that your users have third-party cookies enabled in their browsers, as legacy authentication flows often rely on them. For modern environments, using Connected Apps with JWT tokens avoids most cookie-related issues.
Can I embed Tableau dashboards without requiring users to sign in?
Yes, but this depends entirely on your licensing model. If your organization uses a core-based, on-premise Tableau Server license, you can enable the Guest user option. This allows anyone who can access your web portal to view the embedded dashboard without needing a Tableau account or signing in.
However, this option is not available on user-based licensing models or on standard Tableau Cloud deployments, where every viewer must be authenticated.
What are the licensing requirements for embedded analytics?
To view embedded Tableau content, every user must have a valid license, unless you are utilizing a core-based Tableau Server with Guest access enabled. For external-facing applications, Tableau offers specialized embedded analytics licensing, which often includes consumption-based pricing models based on “impressions” (the number of times a dashboard is loaded).
If you are building a product for multiple external clients, it is vital to design your architecture around Multi Tenant Analytics guidelines to ensure compliant license usage and secure data segregation.
Conclusion
Embedding Tableau can unlock incredible value, turning raw data into interactive, visual stories directly inside your applications. However, as we have explored, building a secure, performant, and fully white-labeled experience from scratch requires wrestling with complex APIs, managing JWT authentication, and handling high licensing costs.
If you are looking for a faster, more cost-effective way to deliver analytics to your users, we can help. Embedportal is a California-based SaaS company that provides a comprehensive, white-label embedding platform for BI dashboards.
Our platform is designed to eliminate the headache of custom portal development. With Embedportal, your team can embed multi-vendor analytics — including Tableau, Power BI, QuickSight, and Metabase — with unified branding, robust row-level security, and seamless single sign-on (SSO) in under an hour.
Instead of spending weeks writing custom integration code and maintaining fragmented systems, we provide a unified orchestration layer that makes your analytics look and feel like a native part of your product.
Ready to simplify your embedded analytics journey? Learn more and get started by visiting Embedportal.