
Supercharge Your App with These Top Embedded Analytics Dashboards
Why Embedded Analytics Dashboards Are Now a Core Product Feature
Embedded analytics dashboards are analytics experiences — charts, reports, KPIs, and AI-driven insights — built directly into your software product, so users never have to leave your app to understand their data.
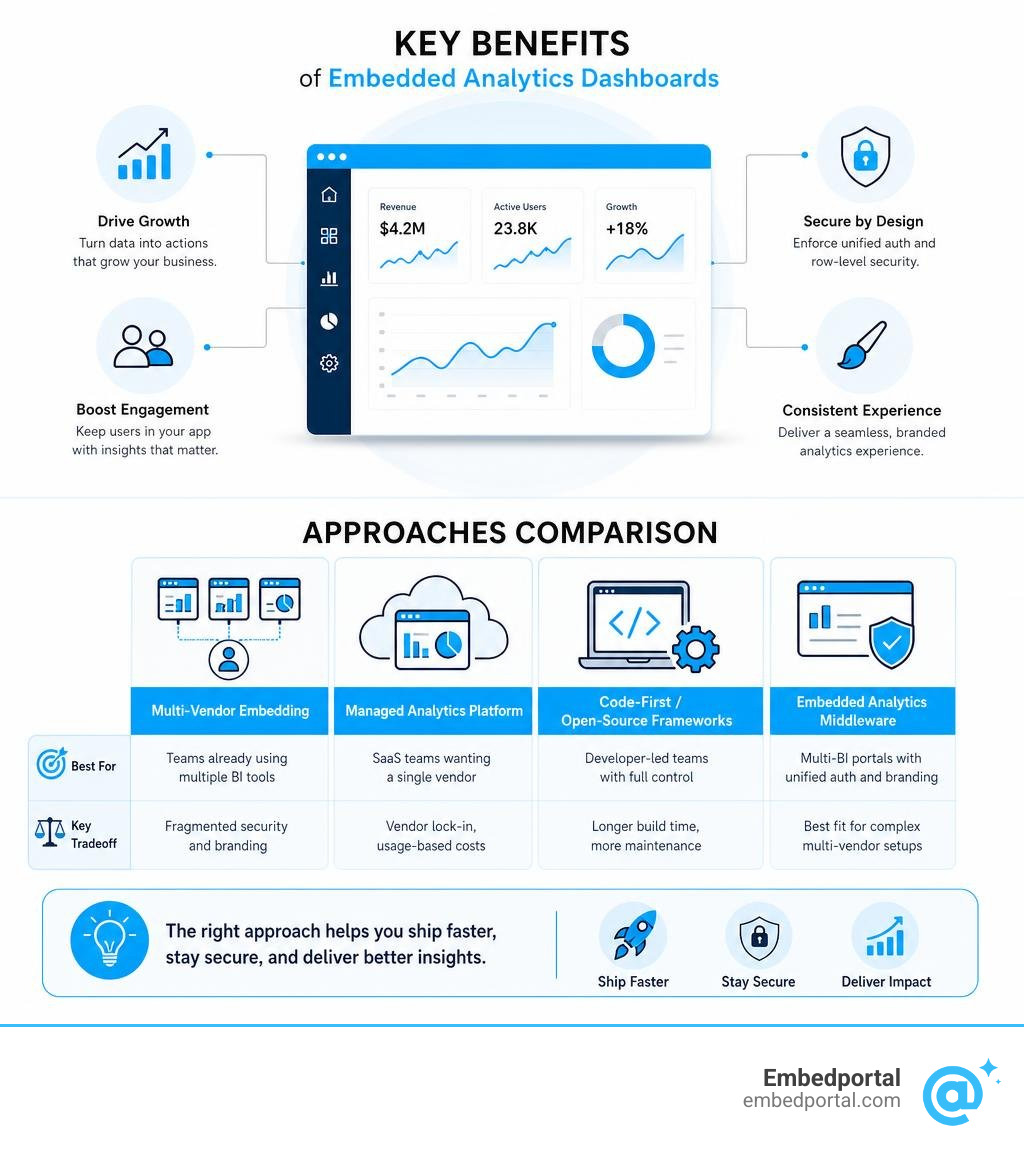
If you’re evaluating your options, here’s a quick snapshot of the top approaches:
| Approach | Best For | Key Tradeoff |
|---|---|---|
| Multi-vendor embedding (Tableau, Power BI, QuickSight) | Teams already using multiple BI tools | Fragmented security and branding |
| Managed analytics platform | SaaS teams wanting a single vendor | Vendor lock-in, usage-based costs |
| Code-first / open-source frameworks | Developer-led teams with full control | Longer build time, more maintenance |
| Embedded analytics middleware (e.g. Embedportal) | Multi-BI portals with unified auth and branding | Best fit for complex multi-vendor setups |
The stakes are real. According to industry research, 57% of product leaders report a direct revenue impact from embedded analytics, and 61% say it increased user engagement. One platform saw 50% user growth in a single year after embedding analytics into its product.
Yet for many product and analytics leads at SaaS companies, the reality is messier. You’re stitching together dashboards from Tableau, Power BI, and QuickSight into a branded customer portal. Each tool has its own auth flow, its own row-level security model, and its own look and feel. The result is slow to ship, painful to maintain, and inconsistent for your users.
The core problem isn’t embedding a dashboard. It’s doing it securely, consistently, and at scale — across multiple BI tools at once.
This guide compares the leading approaches so you can choose the right path for your product.
What is Embedded Analytics and How Does It Differ from Traditional BI?
To understand why product teams are increasingly moving toward Embedded Analytics, we have to look at how businesses historically consumed data.
Traditional Business Intelligence (BI) tools are designed for internal consumption. An analyst builds a report in a standalone desktop tool, publishes it to a secure corporate portal, and internal stakeholders log in to check their metrics. If a customer wants to see their own usage data, someone has to manually run a query, export a CSV or PDF, and email it over.
This workflow creates massive friction. It forces users to perform constant context switching. They must leave the application where they actually do their daily work, log into a separate BI tool, navigate a complex nested folder structure, and try to find the relevant report. More often than not, they simply don’t bother.
Embedded Data Analytics completely flips this model on its head. Instead of treating analytics as an external destination, it integrates data visualizations, interactive charts, and reports directly into the user interface of your existing software application.
This is often achieved using a “headless BI” architecture. In a headless setup, the data processing, query execution, and semantic definitions are decoupled from the presentation layer. This allows product teams to serve real-time, context-aware insights to their users at the exact moment they need to make a decision, without requiring them to leave the active workspace.
For example, instead of a sales rep logging into an external dashboard to see their pipeline health, a CRM can display dynamic win-rate charts and revenue forecasts directly on the deal management screen. The analytics become an organic, native feature of the product itself.
Key Benefits of Embedding Analytics in Customer-Facing Apps
When you embed highly functional dashboards into your customer-facing applications, you are not just checking a feature box—you are fundamentally altering your product’s value proposition.
Here is how delivering native, contextual data experiences directly impacts your core business metrics:
- Accelerated Revenue Growth: Data is a highly monetizable asset. Embedding analytics allows you to create premium, data-driven tiers that customers are willing to pay extra for. In fact, 44% of product leaders expect direct revenue gains from embedding analytics into their products.
- Increased Product Adoption and Retention: When users can easily see the direct value your software provides through clear, interactive reports, they are far more likely to remain active. Providing self-service insights keeps users engaged longer, resulting in a 61% increase in user engagement according to industry benchmarks.
- Reduced Engineering Bottlenecks: Building custom charting libraries, handling complex SQL queries, and manually coding custom filters for every customer request is an absolute drain on engineering resources. Using a robust Embedded Analytics for SaaS strategy offloads this work, allowing your development team to focus on building your core application features.
- Faster, More Informed Customer Decisions: By placing operational data directly inside their workflow, you empower your customers to act quickly. They no longer have to request data exports, run manual pivot tables, or guess which marketing campaign or logistics route is performing best.
How AI Transforms Modern Embedded Analytics Dashboards
In 2026, the baseline expectation for analytics has shifted from static, historical reports to proactive, conversational experiences. Artificial Intelligence is completely rewriting the rules of how users interact with embedded dashboards.
Rather than forcing users to click through dozens of nested filters to find a specific data point, AI-powered embedded analytics platforms introduce several game-changing capabilities:
- Natural Language Queries (NLQ): Users can simply type a question into a search bar—such as “Which region had the highest shipping delays last Tuesday?”—and the system instantly generates the correct visualization.
- Automated Insights and Summaries: AI can automatically scan a dashboard and generate a concise, bulleted summary of key performance indicators (KPIs), explaining the “why” behind a sudden spike or drop in performance.
- Proactive Anomaly Detection: Instead of waiting for a user to discover an issue, background AI agents monitor incoming data streams in real time. If transaction failures spike by 15% after a product deployment, the system flags the anomaly and suggests recommended actions directly within the UI.
Crucially, modern AI implementations in embedded analytics must operate within the strict boundaries of your existing security model. The AI must respect row-level security (RLS) and tenant isolation rules, ensuring that a conversational model never exposes sensitive, cross-tenant data to unauthorized users.
Technical Architecture: How to Embed Dashboards Securely
Building a production-ready embedded analytics experience requires a clear understanding of how data flows from your database to the end user’s screen. The architecture must balance three critical priorities: performance, customization, and absolute data governance.
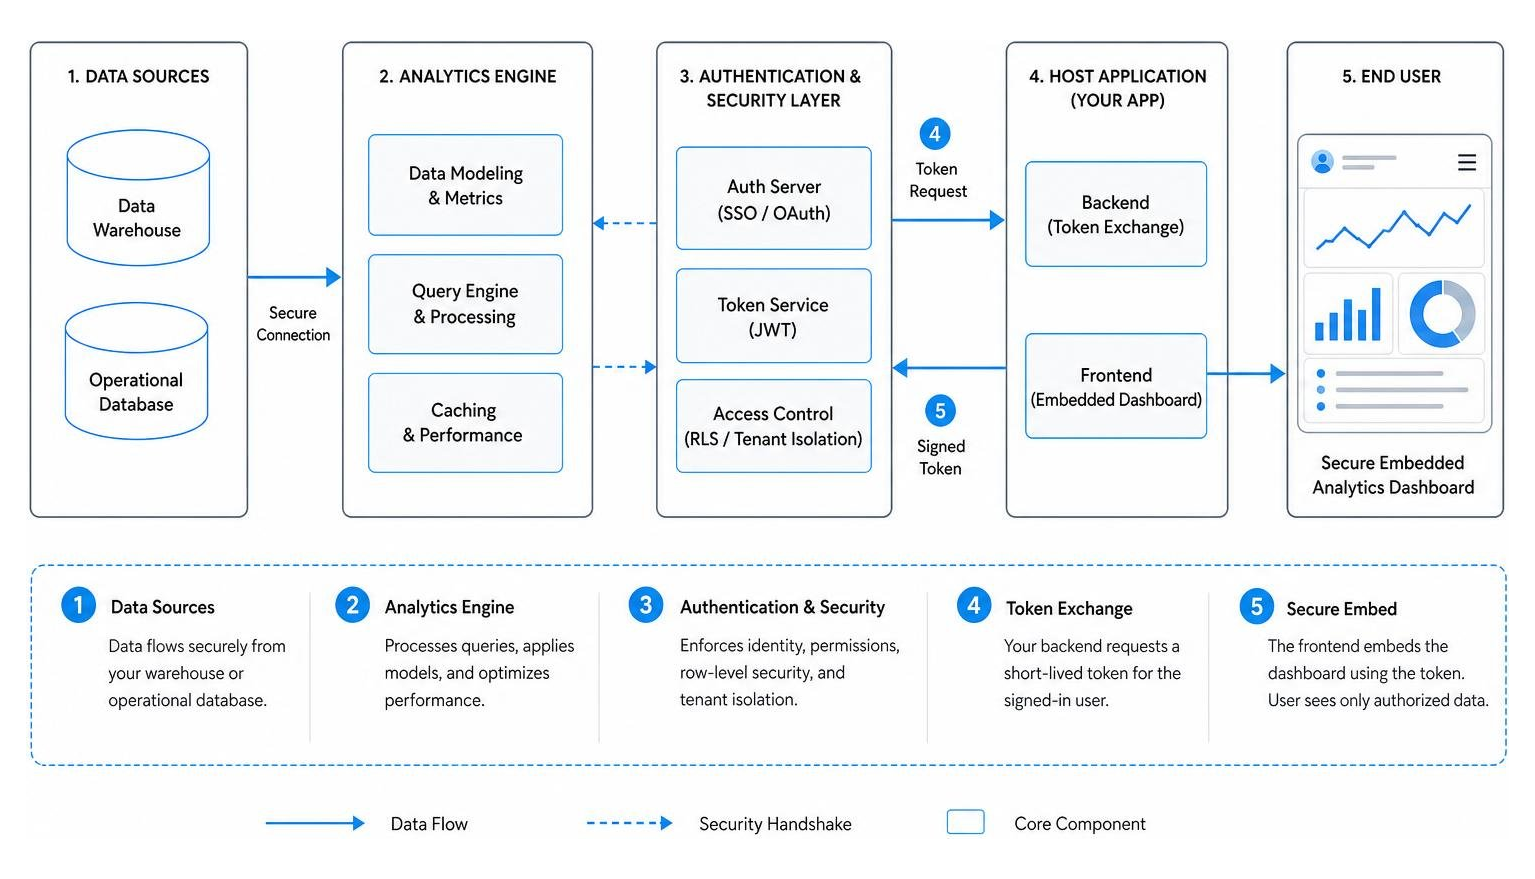
A secure embedded architecture typically consists of several integrated layers. The data layer (your data warehouse or transactional database) sits at the bottom. Above it is the analytics engine, which processes queries and manages data models.
To bridge the gap between the analytics engine and your frontend application, a secure authentication handshake must occur. This is where many teams realize that The Iframe is the Easy Part: What Embedded Analytics Needs. You cannot simply point an iframe to a public dashboard URL and hope for the best; you must establish a secure, server-to-server token exchange to verify who the user is and what data they are permitted to see.
Integration Methods: Iframe vs. SDK and One-Click vs. API-Based
When implementing embedded dashboards, developers generally choose between two primary integration styles:
1. Iframe-Based Embedding
This is the quickest path to production. You generate a secure, authenticated URL on your backend and pass it to an HTML tag in your frontend application.
- Pros: Extremely fast setup, minimal frontend code required, and works with virtually any web framework.
- Cons: Limited programmatic control. Your host application cannot easily listen to filter changes inside the iframe, custom styling is restricted, and it can occasionally suffer from performance lag or layout responsiveness issues on mobile devices.
To see how iframe-like simplicity can be achieved even on resource-constrained devices, developers often look at lightweight, local implementations like grimslice/ESP-DASH or aaronbeckmann/ESP-DashboardPlus, which generate real-time web dashboards directly from microcontrollers using WebSockets.
2. SDK and Web Component Integration
For modern SaaS applications, a Software Development Kit (SDK) or native Web Component integration is the gold standard. Instead of loading an entire external webpage inside an iframe, you use native Javascript components (React, Vue, or Angular) to render specific visualizations.
- Pros: Complete control over the user experience. You can dynamically apply CSS themes to match your brand, trigger actions in your parent application when a user clicks a chart element, and optimize rendering performance.
- Cons: Requires more frontend development and deeper integration with your application’s build pipeline.
Many modern platforms offer flexible paths here, allowing teams to start with simple iframes and graduate to robust SDK integrations. For teams looking for advanced data-layer integration, deep API-based customization can bridge the gap between raw data and native user experiences.
Security Protocols: RLS, CLS, and Tenant Isolation
Security is the single most critical component of customer-facing analytics. In a multi-tenant SaaS environment, where thousands of different companies use the same application infrastructure, you must guarantee absolute data isolation.
To achieve this, your architecture must enforce three levels of security:
- Row-Level Security (RLS): RLS ensures that users can only see specific rows of data. For example, when Customer A logs in, the query sent to the database is automatically appended with a filtering clause like
WHERE tenant_id = 'Customer_A'. This must be enforced at the database or semantic query execution layer, never in the frontend UI, to prevent malicious data tampering. - Column-Level Security (CLS): In some industries, certain users should not have access to specific columns of data (e.g., hiding social security numbers or credit card details from standard support agents while showing them to administrators). CLS dynamically strips unauthorized columns from the query results before they reach the dashboard.
- Tenant Isolation via Guest Tokens: When your application requests an embedded dashboard, your backend server makes an API call to your analytics provider to request a short-lived “guest token” or “embed token”. This token securely encodes the user’s identity, their organizational tenant, and their specific RLS/CLS permissions. The frontend SDK then uses this token to render the dashboard, ensuring the client browser never directly communicates with the database using raw credentials.
Implementing these protocols correctly ensures that your Multi-Tenant Analytics remain completely secure, compliant with SOC 2 Type II and GDPR, and isolated across all customer accounts.
Top Approaches for Implementing Embedded Analytics Dashboards
When deciding how to deliver analytics to your customers, you must weigh the development effort against the long-term flexibility and maintainability of the solution.
| Evaluation Criteria | Build Completely In-House | Buy a Single BI Platform | Multi-Vendor Middleware (Embedportal) |
|---|---|---|---|
| Time to Market | 6–12 months | 1–3 months | Under 1 hour |
| Initial Dev Cost | Extremely High | Medium | Low |
| Maintenance Burden | High (ongoing updates/fixes) | Low (vendor managed) | Low (centralized portal) |
| Branding Flexibility | 100% Native | Restricted to vendor themes | Unified white-labeling |
| Multi-BI Support | No (custom built) | No (single vendor lock-in) | Yes (Tableau, Power BI, etc.) |
Choosing the right approach requires assessing your team’s existing BI stack and long-term product goals. Let’s look at the best options available on the market, which you can compare in detail in our guide on the Best Embedded Analytics Tools.
Option 1: Multi-Vendor BI Dashboard Embedding
Many established enterprises do not use just one BI tool. Your marketing team might live in Tableau, your finance team might build reports in Power BI, and your product team might prefer Amazon QuickSight or Metabase.
If you try to embed these dashboards individually, you run into a massive headache. Each tool requires its own authentication setup, its own custom iframe configuration, and its own styling rules. Your customers end up with a disjointed portal that looks like a patchwork quilt of different software tools.
This is where a multi-vendor Embedded BI middleware platform becomes invaluable. Instead of writing custom integration code for every single BI tool, you use a unified middleware layer to connect all of your existing dashboards.
The middleware handles the SSO authentication, translates user identities into the correct row-level security filters for each respective platform, and wraps every dashboard in a consistent, white-labeled container. This allows you to deliver a seamless, branded customer portal in record time, regardless of which BI tool originally generated the charts.
Option 2: Open-Source and Code-First Frameworks
For developer-led teams that reject standard graphical user interfaces (GUIs) and drag-and-drop builders, “dashboards-as-code” is an increasingly popular alternative.
Using code-first frameworks, your dashboards are defined entirely as YAML or JSON configuration files stored directly in your application’s Git repository.
- Version Control: Every change to a dashboard, metric, or chart layout goes through your standard pull request (PR) and code review workflow.
- Semantic Layer Governance: You define your business metrics (e.g., “Active Users” or “ARR”) once in a central semantic layer. If you need to update the definition of a metric, you change it in one file, and it automatically updates across all embedded dashboards.
- No-Iframe Performance: These frameworks compile directly into native React or Vue components, avoiding the performance overhead and styling limitations of iframes entirely.
While highly flexible, this approach requires significant engineering commitment to maintain the underlying query performance, database connections, and custom frontend components over time.
Monetizing Your Embedded Analytics Dashboards
Embedded analytics should not just be a cost center—it is one of the most effective ways to drive expansion revenue and increase customer lifetime value.
There are three primary strategies for monetizing your customer-facing data:
1. The Premium Tier Upgrade (Feature Packaging)
Offer basic, static reporting in your standard product tier, but gate interactive features behind a premium paywall. If users want to apply custom filters, drill down into transactional details, export raw CSV data, or schedule automated email PDF reports, they must upgrade to your “Enterprise” or “Pro” tier.
2. Interactive Self-Service and Custom Report Builders
Provide a fully white-labeled, self-service authoring environment where your power users can build their own custom dashboards from scratch. By offering White Label Analytics that look and feel entirely like your own application, you can charge a significant premium for this advanced, self-serve capability.
3. Value-Added Data Products
Combine your aggregated, anonymized industry data to offer benchmarking insights. For example, if you run a logistics SaaS, you can sell an add-on dashboard that shows a shipping company how their delivery times compare to the industry average in their specific region.
Evaluating the True Cost: Build vs. Buy
When evaluating whether to build your own analytics engine or purchase an Embedded Analytics Platform, teams almost always underestimate the complexity of building in-house.
The “Build” trap usually starts simple: “We just need a bar chart and a line graph. We can build this in a sprint using an open-source charting library.”
However, as your customer base grows, your engineering team quickly becomes bogged down by a never-ending stream of feature requests:
- “Can we get this report scheduled to our email every Monday?”
- “We need to export this chart as a high-res PDF.”
- “Can we filter this dashboard by three custom parameters?”
- “Why is this dashboard taking 30 seconds to load for our largest client?”
Suddenly, your core product engineers are spending half their sprint cycles maintaining query caching layers, building custom permission engines, and rewriting SQL queries instead of building your core software product. Buying an established platform drastically reduces your time to market, eliminates engineering bottlenecks, and provides a highly scalable, secure infrastructure from day one.
Frequently Asked Questions
Evaluating embedded analytics solutions often brings up critical technical and business questions. Here are the answers to the most common queries we receive from product and engineering teams.
How secure is embedded analytics in a multi-tenant SaaS environment?
Embedded analytics is highly secure when implemented using server-side authentication and database-enforced row-level security. By utilizing a guest token architecture, your application backend verifies the user’s session and requests a short-lived, encrypted token from the analytics platform.
This token specifies exact data access boundaries (such as tenant IDs or regional filters). The database then executes queries using these parameters, ensuring complete tenant isolation. Your database credentials are never exposed to the client browser, and users can never modify query parameters to view another customer’s data.
What is the difference between SDK-based and iframe-based embedding?
The difference comes down to setup speed versus programmatic control:
- Iframe embedding is incredibly fast to implement (often requiring just a few lines of HTML) but acts as an isolated window on your page. You cannot easily style its contents, and it cannot dynamically interact with your parent application.
- SDK-based embedding integrates directly into your application’s codebase using native web components. This gives you full control over custom CSS styling, dynamic responsive layouts, and allows your application to listen to and trigger events based on user interactions inside the dashboard.
How do companies monetize embedded analytics as a product feature?
Companies typically monetize analytics by packaging them into multi-tiered offerings. You can review our detailed breakdown of Embedded Analytics Pricing and learn How Embedded Analytics Pricing Actually Works in 2026 to structure your models effectively.
Most successful SaaS companies offer basic KPI cards in their entry-level plan, charge a 20-30% premium for interactive dashboards with advanced filtering, and charge an enterprise rate for self-service report builders and white-labeled, scheduled report exports.
Conclusion
Delivering high-quality, secure, and beautiful analytics to your customers shouldn’t require months of custom engineering or vendor lock-in to a single BI tool.
At Embedportal, based in sunny California, we help product and data teams bypass the traditional headaches of customer-facing reporting. Our white-label embedding platform acts as a secure, unified middleware layer, allowing you to embed dashboards from Tableau, Power BI, QuickSight, and Metabase directly into your application in under an hour.
With Embedportal, you get:
- Unified Branding: A completely white-labeled portal that matches your exact product styling.
- Simplified Single Sign-On (SSO): A single, secure authentication flow that works across all of your BI tools.
- Robust Multi-Tenant Security: Automated row-level security and tenant isolation that guarantees your customers only see their own data.
Ready to see how easy embedding can be? Book a live Demo with our team today, or explore our platform to Supercharge your app with Embedded BI.

