The Enterprise Guide to Embedding BI Dashboards at Scale
Why Your Enterprise BI Embedding Strategy Determines Product Success
Choosing the right enterprise BI embedding solution is one of the most consequential infrastructure decisions a SaaS product or analytics team will make in 2026.
Here’s a quick answer to what this means and what to look for:
What is an enterprise BI embedding solution? An enterprise BI embedding solution lets you integrate dashboards and analytics from one or more BI tools directly into your own application — with your branding, your security model, and your user experience — so users never have to leave your product to get insights.
The top things enterprise teams evaluate when choosing one:
- Multi-vendor support — Can it embed Tableau, Power BI, QuickSight, and others from a single layer?
- Row-level security — Does it enforce tenant-level data isolation automatically?
- White-label control — Can you fully replace vendor branding with your own?
- Authentication — Does it support SSO via JWT, SAML, OIDC, or OAuth?
- Deployment speed — How fast can you go from zero to a working embedded dashboard?
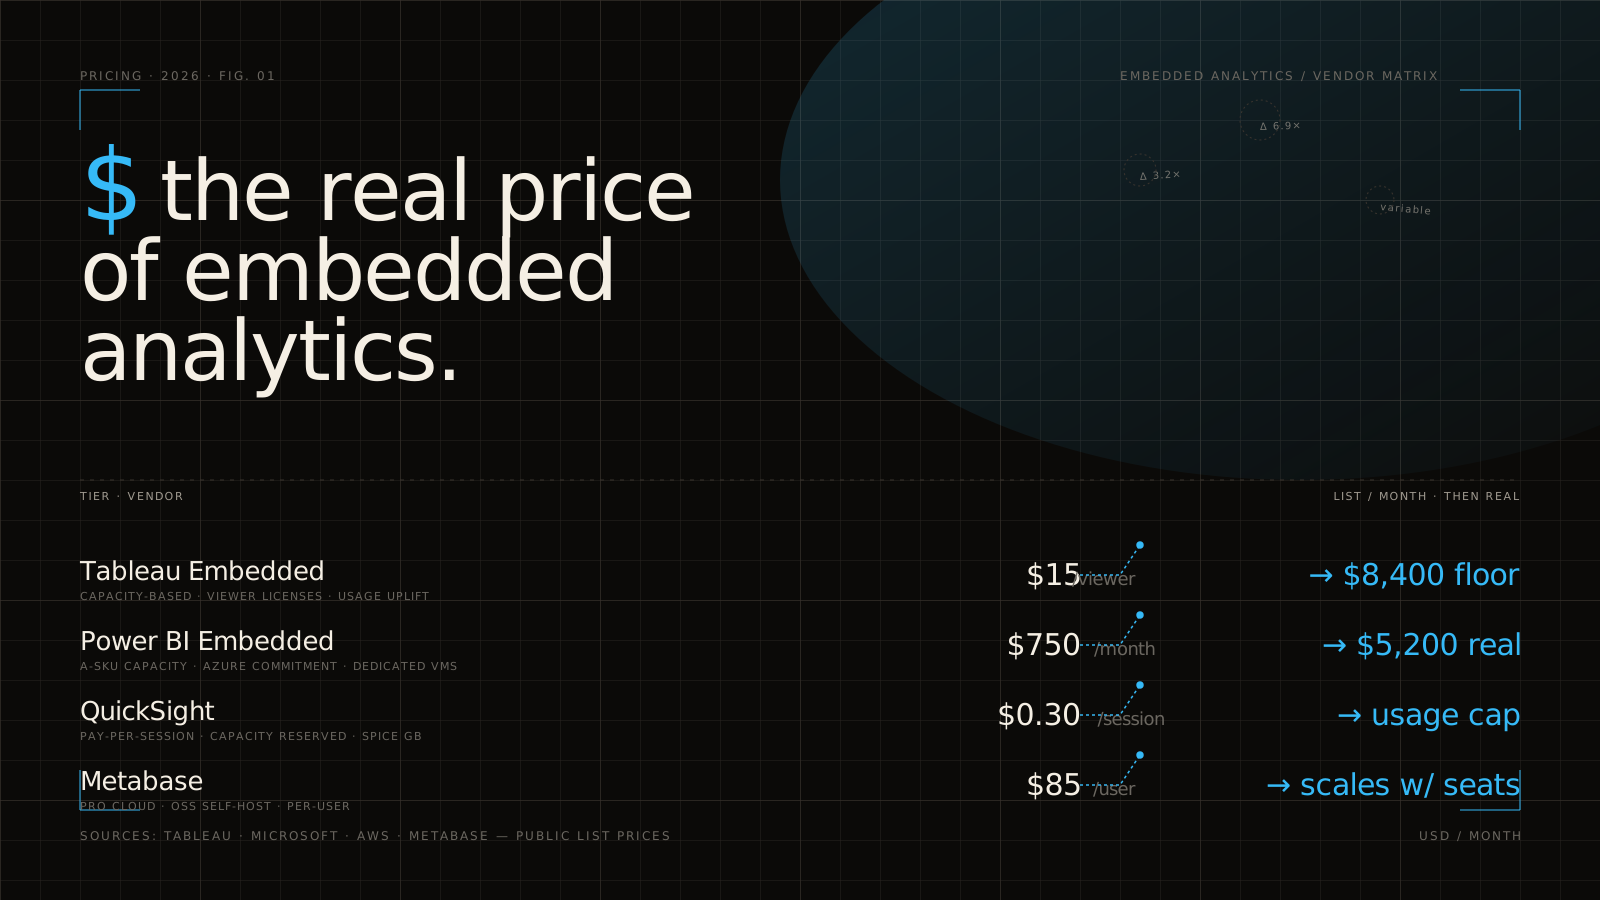
- Pricing predictability — Is the model per-user, capacity-based, or flat fee?
The problem most product and analytics leads run into isn’t a shortage of BI tools. It’s the opposite. You already have Tableau models, Power BI reports, maybe QuickSight dashboards — and your customers expect all of it to appear inside your product, under your brand, with their data scoped correctly.
That’s a much harder problem than embedding a single iframe.
The embedded analytics market is projected to exceed $130 billion by 2029, and organizations that embed analytics into their products report up to 5× faster decision-making. The business case is clear. But the implementation complexity — fragmented row-level security across vendors, inconsistent branding, slow custom engineering work — is where most teams get stuck.
This guide breaks down the key decisions: architecture, security, licensing, build vs. buy, and how the top platforms compare on what actually matters.
Enterprise bi embedding solution terms to remember:
What is Enterprise Embedded BI vs. Traditional BI?
To understand why a dedicated enterprise BI embedding solution is necessary, we must first look at how user expectations have shifted.
Traditional BI tools were built for internal consumption. In this legacy model, business analysts and internal stakeholders log directly into a standalone platform like Tableau or Power BI. They navigate a separate interface, manage a separate set of credentials, and view static dashboards. While this works for internal reporting, it creates a highly fragmented experience. Users are forced to constantly switch contexts between their primary work applications and their analytics tools.

Embedded Analytics changes this entirely by bringing data directly to where the user already works. Instead of forcing a sales rep to leave their CRM or a customer to log into a separate client portal, Embedded BI integrates interactive dashboards, reports, and self-service exploration tools directly into your application’s native user interface.
This integration does more than just save clicks. It fundamentally drives user adoption and nurtures a true data-driven culture. When insights are presented in context, users can make decisions instantly. For example, a supply chain manager looking at an inventory dashboard inside an ERP can immediately reorder stock without leaving the screen.
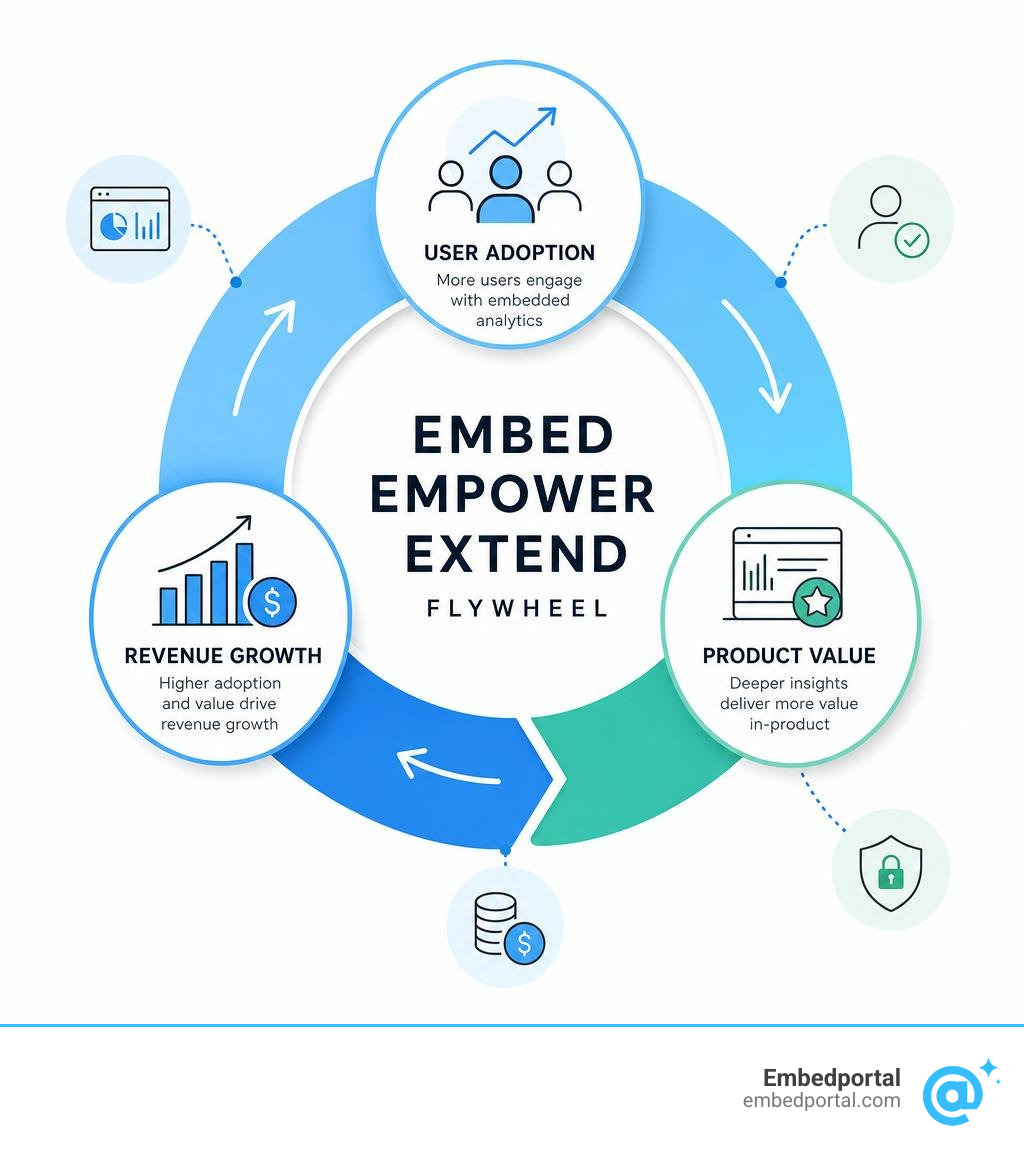
For software providers, embedding analytics is a core driver of value. Whether you are building customer-facing portals, internal business tools, or commercial SaaS products, in-app analytics increase user engagement, improve customer retention, and unlock new premium revenue tiers. Data-driven organizations are 23× more likely to acquire customers, and keeping those customers engaged with native, context-aware analytics is the easiest way to prevent churn in 2026.
Build vs. Buy: Choosing an Enterprise BI Embedding Solution
When product teams realize they need in-app reporting, they inevitably face the classic dilemma: should we build this analytics infrastructure from scratch, or should we buy a dedicated Embedded Analytics Platform?
Building analytics in-house using basic charting libraries (like D3.js or Chart.js) often seems appealing to developers at first. However, teams quickly discover that the visualization layer is only about 10% of the actual work. The real engineering costs lie in the unseen infrastructure: building secure data connectors, managing query performance, setting up caching layers, designing a user-friendly dashboard builder, and implementing complex multi-tenant access controls.
An in-house build can easily take 6 to 12 months of dedicated engineering time, costing anywhere from $300,000 to over $600,000 in Year 1 alone. Furthermore, it creates a perpetual maintenance overhead. Every time a customer wants a new filter, a different chart type, or a custom report, your core engineering team must pull themselves away from your primary product roadmap to write custom code.
By choosing a modern SaaS BI Embedding solution, you bypass this technical debt entirely. Instead of spending months building database connections and visualization engines, you leverage your existing BI tools (such as Power BI, Tableau, or QuickSight) and use an embedding layer to publish them securely in weeks — or even days. This significantly accelerates your time-to-market while giving you deep SDK control and complete white-labeling capabilities. You get the polish of a fully custom-built solution without the massive engineering resource drain. More details on the strategic trade-offs can be explored in this guide on What is Embedded Business Intelligence (BI)? Build or Buy?.
App Owns Data vs. User Owns Data Models
If you decide to leverage existing BI platforms for your application, you must choose between two primary architectural authentication paths. Understanding the difference between these models is crucial, as highlighted in the Power BI embedded analytics overview.
The core distinction lies in how users are authenticated and who “owns” the data credentials:
- App Owns Data (Non-Interactive Authentication): This model is designed specifically for external users, customers, and SaaS deployments. In this scenario, your application’s users do not need to have their own individual BI platform licenses (like a Power BI Pro or Tableau Creator license). Instead, your application authenticates with the BI service using a single master user account or a secure Service Principal. The application “owns” the connection, retrieves the dashboard on behalf of the user, and securely passes the user’s specific context to filter the data. This is the foundation of App Owns Data vs User Owns Data architectures.
- User Owns Data (Interactive Authentication): This model is typically used for internal organizational tools. Here, every user viewing the embedded dashboard must have their own active license and credentials for the underlying BI tool. When they open your application, they are prompted to sign in with their BI account (e.g., Entra ID for Power BI). The BI platform verifies their individual permissions before rendering the report.
For customer-facing SaaS products, the “App Owns Data” model is almost always the correct choice, as it eliminates the friction of licensing and onboarding external users onto a third-party BI platform.
Key Architectural and Security Requirements
Deploying an enterprise BI embedding solution at scale requires careful planning around your underlying data architecture. Enterprise applications cannot afford performance lag, security leaks, or rigid visualization components.
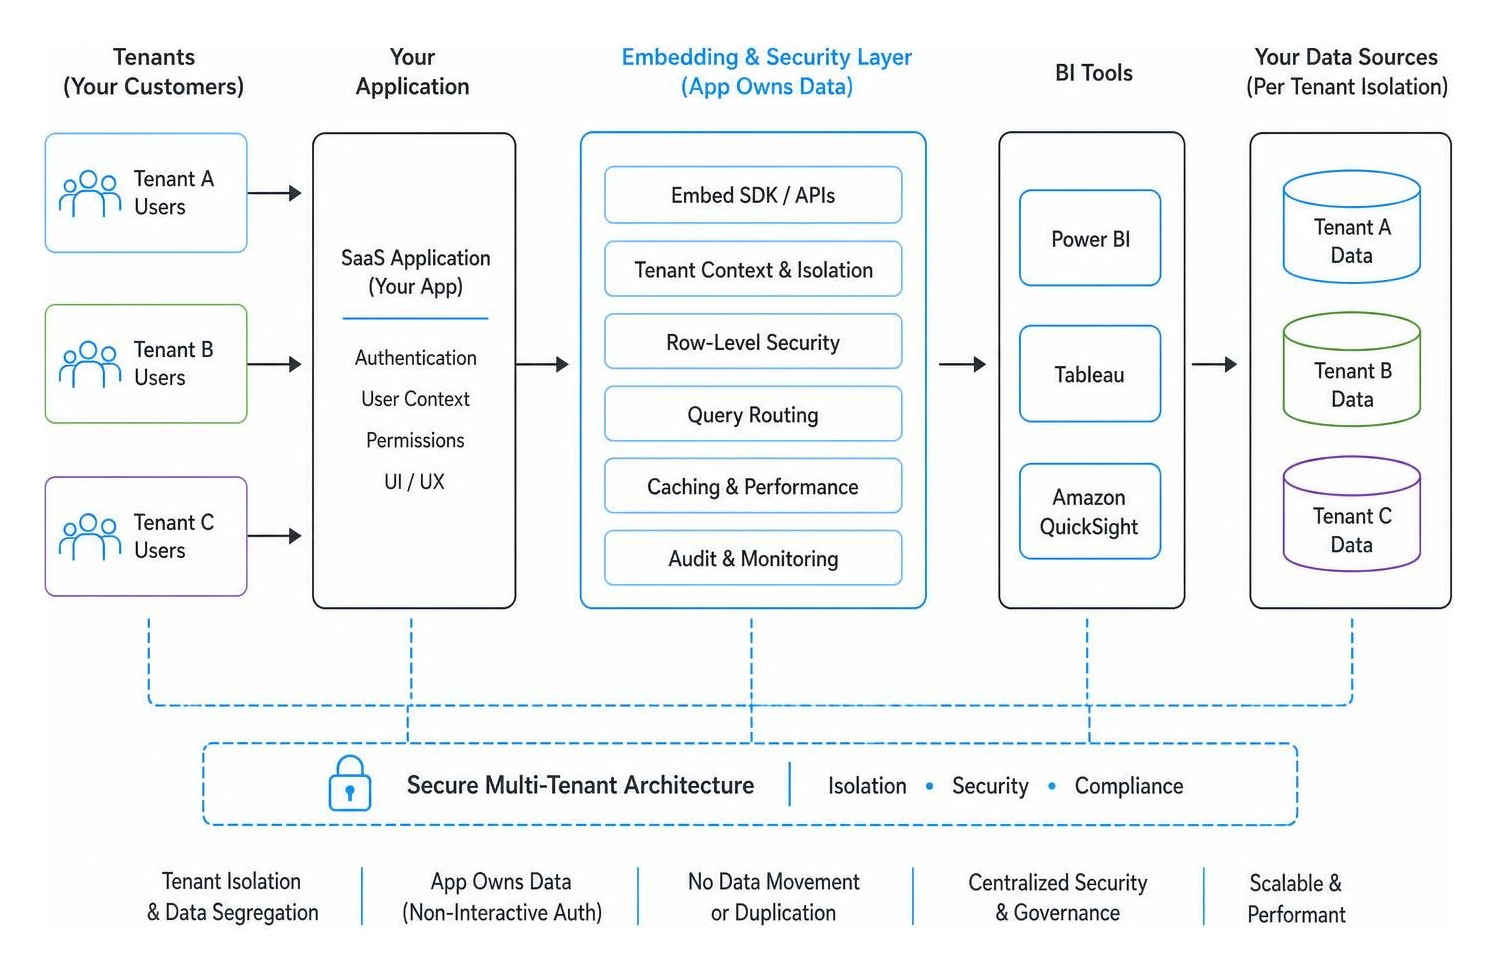
To deliver a truly native experience, your embedding solution must sit cleanly on top of your existing data stack. Rather than forcing you to move, duplicate, or sync your data into a proprietary analytics database, a modern embedding layer should act as a secure pass-through. It should communicate directly with your BI tools and your warehouse, leaving your data exactly where it lives.
Beyond simple visualization, three advanced capabilities are transforming how enterprises utilize embedded BI in 2026:
- The Semantic Layer: A robust semantic layer ensures that business logic, metric definitions, and calculations are defined once and applied consistently across all dashboards, regardless of which underlying BI tool is rendering the visual.
- Writeback Capabilities: Historically, embedded dashboards were strictly read-only. Today’s enterprise users expect to take action directly within the report. Writeback capabilities allow users to update database values, trigger workflows, or input comments directly from the embedded dashboard interface.
- AI and Natural Language Querying (NLQ): Integrating conversational AI agents into your analytical workspace allows non-technical users to ask complex questions in plain English (e.g., “Which region saw the highest margin growth last quarter?”) and receive instant, dynamically generated charts.
As teams plan these integrations, they quickly realize that The Iframe is the Easy Part What Embedded Analytics Needs. Managing the complex security, performance, and state-synchronization layers around that iframe is what determines success. True Embedded Data Analytics requires a unified architecture that handles authentication, performance caching, and multi-tenant logic flawlessly.
Multi-Tenancy and Security in an Enterprise BI Embedding Solution
When you serve multiple customers (tenants) from a single application, preventing data cross-contamination is your absolute highest priority. You must guarantee that Tenant A can never, under any circumstances, view the data of Tenant B.
Implementing secure Multi-Tenant Analytics requires a multi-layered security strategy:
- Row-Level Security (RLS): This is the gold standard for data isolation. Instead of creating separate dashboards for every single customer, you build a single master dashboard. When a user requests to view the dashboard, your application passes their tenant ID and role attributes. The database or BI tool uses Row Level Security to filter the underlying data query at runtime, ensuring only the permitted rows are returned.
- Centralized vs. Multi-Tenant RLS: Depending on your database architecture, you may choose Multi-Tenant Row Level Security built directly into your cloud warehouse, or a Centralized Row Level Security model managed at the BI semantic layer. Regardless of where it lives, the security rules must be dynamically applied based on the user’s active session.
- Token-Based Security (JWT SSO): To connect your application’s authentication system with the embedded dashboards, you must use secure, short-lived JSON Web Tokens (JWTs). When a user logs into your app, your server generates a signed JWT containing the user’s identity, tenant context, and security roles. This token is passed to the embedding layer, which securely validates it before displaying the dashboard.
This token-based architecture ensures that your data governance policies remain airtight, even when distributing reports to thousands of external users.
Evaluating Licensing, Capacity, and Pricing Models
One of the most common pitfalls in enterprise BI projects is overlooking how licensing and hosting capacity models scale as your user base grows. If you do not choose your commercial model carefully, a successful product launch can quickly lead to astronomical, unpredictable software bills.
When evaluating an enterprise BI embedding solution, you will typically encounter a few distinct pricing structures:
| Pricing Model | Best For | Pros | Cons |
|---|---|---|---|
| Capacity-Based | Predictable enterprise workloads | No per-user fees; dedicated performance | High entry cost; must manage scaling manually |
| Flat-Fee | Rapidly growing SaaS apps | Highly predictable costs; unlimited scale | Less granular control over dedicated resources |
| Server Core-Based | On-premises or private cloud | Absolute control over infrastructure | Requires active DevOps management |
| Per-User Fees | Small-scale internal deployments | Low cost to start | Becomes cost-prohibitive at scale |
Understanding how Embedded Analytics Pricing scales is critical. To avoid unexpected surprises, product teams must model their total cost of ownership (TCO) based on expected query volumes, concurrent user spikes, and potential token usage limits. For an in-depth breakdown of these dynamics, consult our guide on How Embedded Analytics Pricing Actually Works in 2026.
Licensing Models for an Enterprise BI Embedding Solution
Let’s look at how these licensing models play out in real-world platforms:
- Capacity-Based Licensing (e.g., Microsoft Power BI): To move beyond limited free trial tokens, production deployments of Power BI Embedding require dedicated capacity. This is purchased through various SKUs. For example, A-SKUs are billed hourly and are ideal for development and testing, while P-SKUs (Premium) and F-SKUs (Fabric) provide dedicated cloud power for large-scale enterprise production. Understanding Power BI Embedded Pricing and navigating Power BI Licensing is essential to ensure you don’t overpay for unused cloud resources.
- Flat-Fee Licensing: Some platforms offer a transparent, flat-rate model with no per-user fees or data limits. This is highly attractive for customer-facing SaaS companies, as it allows you to scale your user base to millions of viewers without your software costs increasing by a single cent.
- Server Core-Based Licensing: Often used in hybrid or on-premises enterprise environments, this model charges based on the number of CPU cores allocated to the analytics engine. It provides predictable pricing and complete control over where your data is processed and stored.
For SaaS applications, we highly recommend selecting a flat-fee or predictable capacity-based model to ensure your margins remain healthy as your user base expands.
Frequently Asked Questions about Embedded BI
What is the difference between iframe and SDK embedding?
The choice between embedding via a standard iframe or utilizing a JavaScript SDK comes down to how native and interactive you want the user experience to be.
An iframe is the simplest, fastest way to get a dashboard onto a webpage. It provides excellent security isolation because the report runs in its own separate browser context. However, it behaves like an isolated window; your host application cannot easily interact with the dashboard, pass dynamic filters on the fly, or listen to user click events.
A JavaScript SDK, on the other hand, provides deep integration. It allows your developers to write code that interacts directly with the report elements. You can trigger custom CSS theming, capture click events to open native application modals, and dynamically modify filters based on user actions outside the dashboard. If you want to deliver a highly polished, fully customized White Label Analytics experience where the user cannot tell that a third-party BI tool is running under the hood, the SDK approach is the clear winner.
How does embedded BI handle external user access?
Managing External User Access is a core challenge for enterprise apps. You must securely authenticate users who exist outside your corporate directory without creating operational friction.
Most modern embedding architectures handle this by utilizing secure, single-use tokens. Rather than creating individual user accounts inside your BI platform (which would require complex User Management for BI and escalate licensing costs), your application acts as the gatekeeper.
When an external customer requests access to a dashboard, your application verifies their credentials locally. It then requests a secure embed token from the BI service, injecting the user’s specific security filters. For organizations utilizing Microsoft ecosystems, this process bypasses traditional barriers like Power BI External Users licensing or configuring manual Power BI Guest Access.
By routing all requests through secure, token-based Shared Dashboard Access protocols, you maintain strict control over Dashboard Data Access without forcing your customers to manage another set of logins.
What is the typical implementation timeline for enterprise embedding?
The time it takes to launch an embedded BI experience depends heavily on your chosen integration path:
- In-House Build: Typically takes 6 to 12 months of dedicated development, testing, and security auditing.
- Traditional BI SDKs: Usually requires 2 to 3 months of setup, particularly when configuring complex single sign-on (SSO) and row-level security across multiple environments.
- Embedportal: Typically takes under an hour to connect your existing BI tools, define your row-level security rules, and drop a fully branded, secure dashboard portal into your application.
For SaaS companies, choosing a rapid-deployment platform is the most effective way to accelerate your Embedded Analytics for SaaS roadmap and begin generating analytics revenue immediately. If you want to explore other tools in the market, check out this comprehensive list of the Best Embedded Analytics Tools and how they handle cloud integrations like AWS Embedded Analytics.
Conclusion

Building a modern, scalable, and secure analytical experience for your users doesn’t have to be an exhausting engineering project. The traditional choice between spending months writing custom visualization code or forcing your users to log into disjointed, unbranded BI tools is a false dichotomy.
With Embedportal, you get the best of both worlds.
We provide a powerful, white-label embedding platform that acts as the unified “glass” over your entire BI stack. Whether you use Tableau, Power BI, QuickSight, or Metabase, Embedportal lets you embed your existing dashboards inside a beautifully branded customer portal in under an hour. You define your row-level security and single sign-on (SSO) rules once in our centralized control plane, and we automatically translate and enforce those rules down to each BI vendor’s native security mechanism.
No data pipelines to manage. No complex SDKs to write. Just secure, unified, and stunning analytics delivered directly to your customers under your own brand.
Ready to see how easy enterprise BI embedding can be?
Secure your data and try our Row-Level Security playground today