Stop Coding Reports Manually and Use an Embed Reporting Platform
Why Manual Report Embedding Is Costing Your Team More Than You Think
An embed reporting platform is software that lets you display dashboards and reports directly inside your own product or portal — without building the data infrastructure from scratch.
If you’re evaluating your options, here’s a quick summary:
| Option | Best For | Key Trade-off |
|---|---|---|
| Build in-house | Full custom control | 9+ months, high ongoing cost |
| iframe-based embed | Quick one-off embeds | Limited branding, security gaps |
| Embedded reporting platform | SaaS products, portals, ISVs | Faster, but requires vendor selection |
| Multi-vendor embed portal | Teams using Tableau, Power BI, etc. | Unified auth + RLS across tools |
Most SaaS analytics or product leads hit the same wall. You’re stitching together reports from multiple BI tools — Tableau, Power BI, Metabase — and each one has its own authentication, its own row-level security model, and its own branding quirks. Your customers see a patchwork portal that looks nothing like your product. Your engineers are stuck maintaining custom embedding code instead of shipping features.
This is not a niche problem. Embedded reporting is about integrating BI components like reports, dashboards, and data visualizations directly into the business workflows your users rely on every day. When done right, users never have to leave your product to get answers. When done wrong, it becomes a permanent engineering tax.
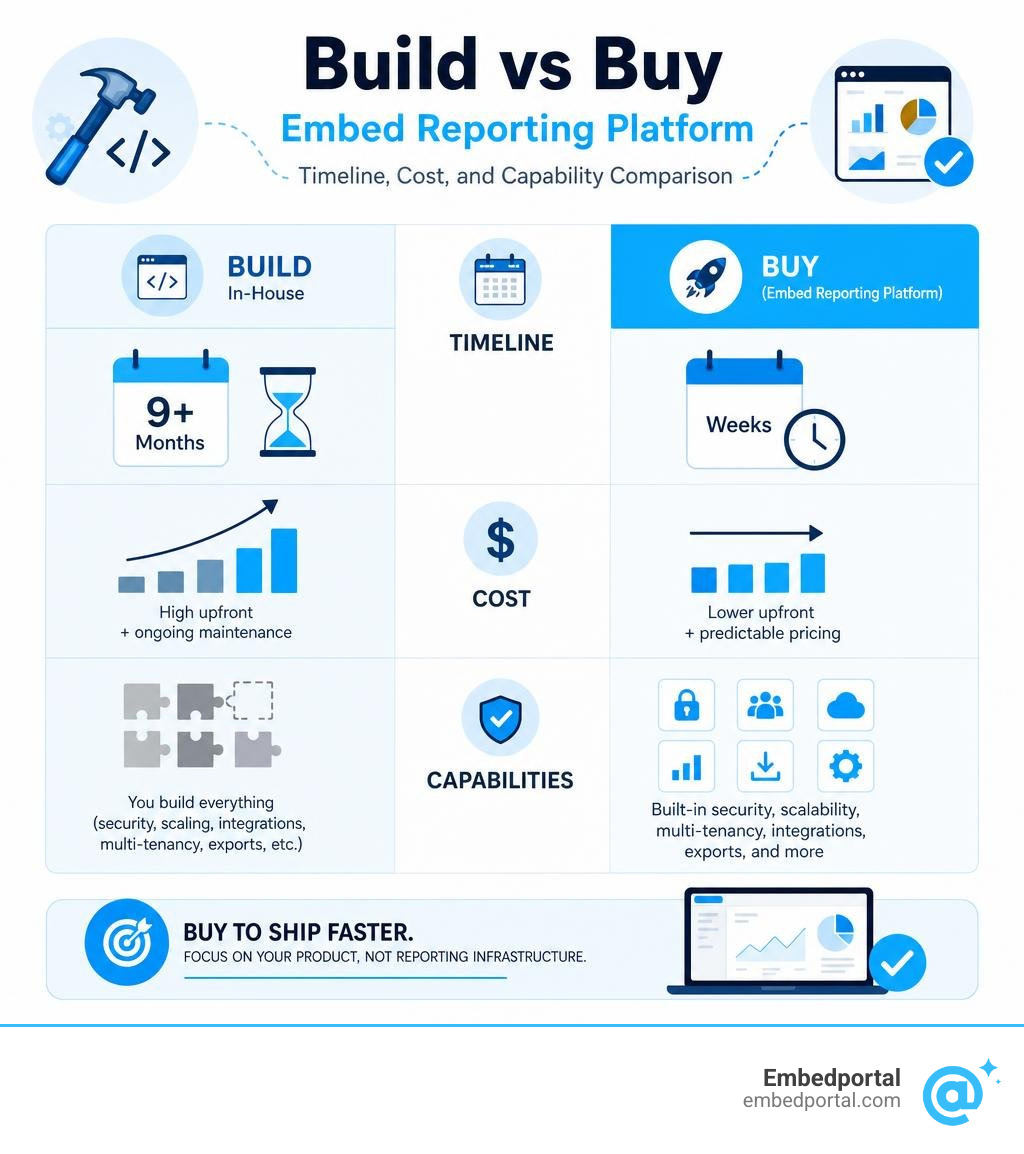
The build-vs-buy question is real. Building your own analytics embedding layer in-house typically takes over nine months — and that’s before you account for ongoing maintenance, security updates, and multi-tenant edge cases.
This guide compares the leading embed reporting platforms available in 2026 so you can make the right call for your stack, your team, and your customers.
What is an Embed Reporting Platform and How Does It Work?
At its core, an embed reporting platform functions as the bridge between your raw data or business intelligence (BI) systems and your customer-facing application. Instead of forcing your software engineers to manually write code for every chart, data table, and export button, the platform provides a pre-built, secure delivery mechanism.
To understand how it works, we have to look at the architectural shift it represents. In a traditional setup, you have a standalone BI tool where internal analysts build dashboards. If an external customer needs access to those insights, they are typically forced to log into a separate portal, or worse, request a manual PDF export from your customer support team.
An embedded platform completely changes this dynamic. It acts as an orchestrator. It securely connects to your business data sources or your existing BI deployment, handles user authentication, translates permissions, and renders the visual output directly inside your application interface.

This architectural layer means you get the best of both worlds: your data team can continue using robust, industry-standard BI tools to design reports, while your product team can deliver a seamless, native-feeling user experience without writing thousands of lines of custom charting code. For a deeper dive into how these architectures function, check out our guide on the Embedded Analytics Platform.
Furthermore, modern platforms leverage advanced middleware patterns. Instead of moving or copying your data into yet another database (which introduces latency, synchronization bugs, and security risks), a modern portal queries the data source or your BI vendor directly. It serves as a secure, real-time “glass in between” your users and your data stack. For more context on integrating these capabilities, see the resources on Embedded Analytics and Reporting.
Embedded Reporting vs. Embedded Analytics
While the terms are often used interchangeably, there is a distinct functional difference between embedded reporting and Embedded Analytics. Understanding this difference is crucial for aligning your project with user expectations.
Embedded reporting is primarily focused on structured, operational, and often print-ready or pixel-perfect reports. Think of financial invoices, compliance audits, daily inventory summaries, or scheduled performance digests. These reports are highly formatted, organized, and designed to show a specific point-in-time snapshot of business operations. They prioritize precision, structured layouts, and clean multi-page exporting (like PDFs or Excel files).
Embedded analytics, on the other hand, is centered around interactive dashboards, visual exploration, and ad-hoc data discovery. It is designed for users who want to click around, apply dynamic filters, drill down into specific data points, and ask conversational questions of their data.
- Embedded Reporting: Pixel-perfect layouts, operational tables, scheduled exports, and highly structured, print-ready documents.
- Embedded Analytics: Interactive charts, real-time dashboards, conversational AI queries, and open-ended data exploration.
Most modern applications actually require a blend of both. Users want an interactive dashboard to monitor their daily metrics, but they also need the ability to generate a highly structured, pixel-perfect PDF report for their quarterly board meetings.
How an Embed Reporting Platform Integrates with Modern Apps
Integrating reporting components into a modern web application requires a secure, flexible, and performant developer workflow. Modern platforms achieve this by offering multiple integration pathways, allowing your development team to choose the method that best fits your technical stack:
- Application Programming Interfaces (APIs): RESTful APIs are the backbone of secure embedding. They handle the server-to-server communication, generating secure, short-lived single sign-on (SSO) tokens that authenticate your application’s users with the reporting platform.
- Software Development Kits (SDKs): SDKs provide language-specific libraries (such as React, Angular, Vue, or Python) that simplify integration. For example, developers can leverage libraries like the thoughtspot/visual-embed-sdk to quickly initialize and control embedded assets directly within their frontend code.
- Web Components: The modern standard for native-feeling integration. Web components allow developers to insert reports using standard HTML-like tags (e.g.,
- HTML iframes: The fastest way to get up and running. By embedding an iframe with a secure, signed URL, you can display complex reports with minimal frontend code. While historically criticized for being difficult to style, modern platforms offer advanced iframe post-message APIs that allow your parent application to communicate dynamically with the embedded report.
For a step-by-step breakdown of how these integration pathways are implemented in production, refer to the Embedportal Documentation.
Key Benefits and Best Practices of Embedded Reporting
Implementing a dedicated embedding platform yields massive dividends for both your internal product teams and your external customers.

By outsourcing the heavy lifting of visualization, authentication, and layout rendering to a specialized platform, you unlock several key business advantages:
- Accelerated Time-to-Market: Building a custom reporting engine from scratch can easily consume quarters of engineering time. Utilizing a pre-built platform reduces this timeline to weeks, or even days, allowing you to ship customer-facing value almost immediately.
- Maximum Engineering Focus: Your developers should be building the core features that make your SaaS product unique, not writing custom export-to-CSV scripts or debugging CSS grid layouts for chart legends.
- Increased User Engagement: Providing interactive, real-time data directly inside your application keeps users engaged. Instead of exporting data to analyze it elsewhere, they spend more time inside your product making data-driven decisions.
To capture these benefits, organizations must design their implementations around proven Embedded Analytics for SaaS frameworks.
Why SaaS Companies and ISVs Choose to Embed
For Software as a Service (SaaS) companies and Independent Software Vendors (ISVs), analytics are no longer a “nice-to-have” feature — they are a core driver of customer retention and product value.
When a SaaS company attempts to build reporting in-house, they often underestimate the long-term maintenance burden. It starts simple: a basic bar chart showing monthly usage. But soon, Customer A wants a line chart. Customer B wants to filter by region. Customer C demands automated weekly PDF emails. Customer D requires custom row-level security so their managers can only see data for their respective teams.
Suddenly, your product roadmap is hijacked by reporting requests.
By utilizing an embedding platform, SaaS teams can deploy a highly customizable, self-service reporting experience that satisfies these diverse customer demands out of the box. This dramatically increases the perceived value of your software license, directly impacting customer retention and opening up opportunities for premium, upsell analytics tiers. To ensure a smooth rollout, teams should follow established Embedded Analytics Best Practices.
The End-User Experience of a Modern Embed Reporting Platform
From the perspective of your end users, the embedding should be completely invisible. They should not feel like they are looking at a clunky external tool shoehorned into your application.
A modern, high-quality user experience is characterized by:
- Zero Context Switching: Users can access interactive reports and dashboards directly within their natural workflow. They don’t need to open a new browser tab, log into a separate portal, or wait for an email attachment.
- Self-Service Capabilities: Rather than being limited to static charts, users can interactively drill down, apply date ranges, filter by dimensions, and even build their own ad-hoc reports in real time.
- Real-Time Data Access: Reports reflect up-to-the-minute operational changes, enabling immediate, actionable business decisions.
- Consistent Performance: Dashboards load instantly, utilizing advanced caching and query optimization strategies so that heavy data queries never slow down the main application interface.
To explore how these user-experience standards are configured in real-world environments, review the Embedportal Features guide.
How to Evaluate and Choose the Right Solution
Choosing the right platform for your business requires a careful balancing act between developer control, business user flexibility, and licensing costs. To help you evaluate the path forward, consider this comparison between building an embedding layer in-house versus adopting a specialized platform:
| Evaluation Criteria | In-House Build | Dedicated Embed Platform |
|---|---|---|
| Development Timeline | 9+ months of initial engineering | Under 2 weeks to production |
| Ongoing Maintenance | High (browser updates, security patches) | Minimal (managed by vendor) |
| Branding & UX | Fully custom, but expensive to modify | Native-feeling, customizable white-labeling |
| Security & RLS | Manually coded per database/tenant | Built-in, automated token exchange |
| Multi-Vendor Support | Virtually impossible without rebuilding | Unified portal for Tableau, Power BI, etc. |
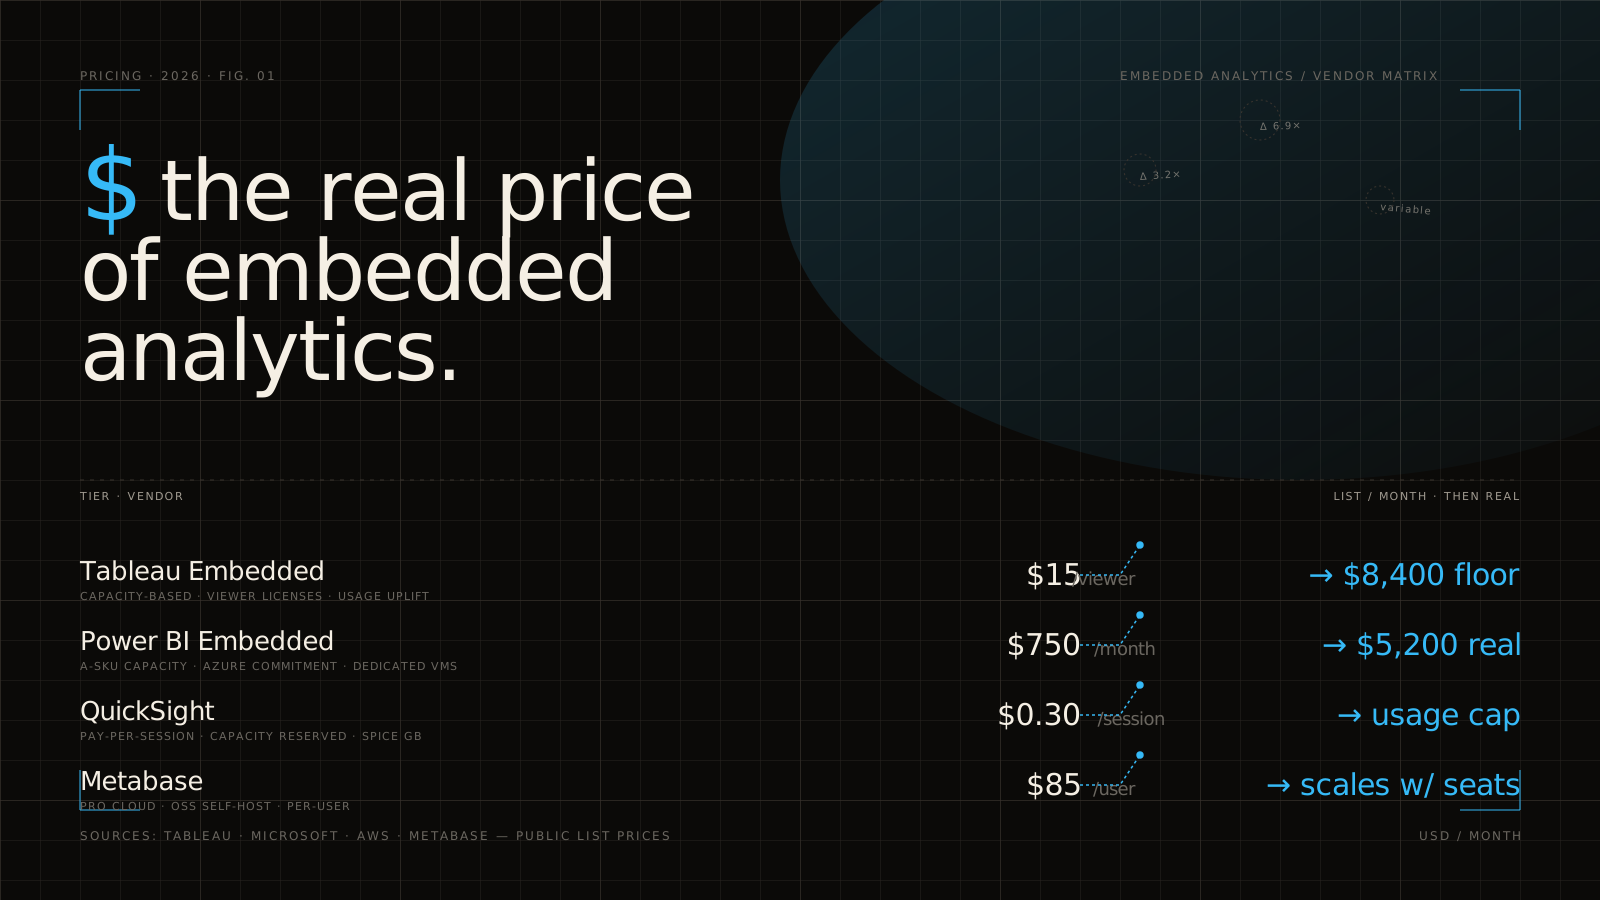
When reviewing platforms in 2026, it is vital to pressure-test their pricing models. Avoid platforms that charge variable fees based on the number of end-user seats or query volumes, as these models can quickly become cost-prohibitive as your customer adoption scales. Instead, look for predictable, flat-rate pricing models that align with your business growth. For a comprehensive review of the market, check out our analysis of the Best Embedded Analytics Tools.
Security, Multi-Tenancy, and Row-Level Security
In any customer-facing application, security is non-negotiable. You must guarantee absolute tenant isolation: Customer A must never, under any circumstances, see even a single row of Customer B’s data.
This is where Row Level Security (RLS) becomes critical.

A modern embedding platform handles this by integrating seamlessly with your application’s identity provider. When a user logs in, your application generates a secure JSON Web Token (JWT). This token contains the user’s identity, their organization ID, and their specific access permissions.
When the embedded report is requested, the platform signs this token at the edge and forwards the user’s specific filters directly into the underlying BI engine (such as Tableau’s User Filters, Power BI’s Effective Identities, or QuickSight’s session tags). The user only sees the data they are explicitly authorized to view, managed entirely through a secure, single source of truth. For more details on designing secure environments for multiple clients, explore our guide on Multi-Tenant Analytics.
White-Labeling and Customization Capabilities
To deliver a truly seamless user experience, the embedded reports must look and feel like an organic part of your application. This requires deep White Label Analytics capabilities.
A professional embedding platform should allow you to:
- Remove all third-party watermarks, brand names, and logos.
- Apply custom CSS, fonts, and color palettes to match your exact product branding.
- Configure tenant-aware themes, allowing you to dynamically change the branding, colors, and logos based on which specific customer is logged in.
- Customize tooltips, loading indicators, and export menus so they align with your parent application’s user interface.
Frequently Asked Questions about Embedded Reporting
What is the difference between iframe and SDK embedding?
The choice between iframe and SDK embedding comes down to a trade-off between deployment speed and user-experience control.
An iframe is incredibly simple to implement and works across virtually any web framework. However, it operates inside an isolated browser sandbox, making it harder to dynamically style and preventing seamless interaction between the report and your parent application.
An SDK or Web Component approach offers much deeper integration. It allows the embedded elements to load directly within your application’s DOM, enabling faster load times, responsive styling, and the ability to listen to frontend events (like clicking a chart element to trigger an action in your SaaS app). For a detailed implementation comparison, refer to the Embedportal Integration Guide.
How does row-level security work in a multi-tenant application?
In a multi-tenant application, row-level security is enforced through secure token exchange. When a user requests a page containing an embedded report, your backend server generates a short-lived, signed security token (typically a JWT). This token securely passes the user’s tenant ID and role to the embedding platform.
The platform validates the signature at the edge and translates these claims into the native security rules of your underlying data source or BI tool. This ensures that data segregation is maintained at the query level, meaning the database only returns the specific rows the user is allowed to see. For an in-depth security architectural blueprint, see Embedportal Security.
Should we build our own reporting tools or buy a platform?
While building your own reporting tools in-house can seem attractive initially, the opportunity cost is almost always too high.
Developing custom charts, drag-and-drop report builders, automated email schedulers, and secure export engines requires a massive, ongoing engineering commitment. It diverts your best developers away from building your core product features.
By purchasing a dedicated embedding platform, you eliminate this maintenance burden, reduce your time-to-market from months to days, and ensure your reporting infrastructure is secure, performant, and scalable from day one.
Conclusion
Manually coding reports and dashboards is a costly distraction for modern software teams. In 2026, the standard for customer-facing data delivery has shifted toward specialized, developer-friendly embedding platforms that handle the complex infrastructure of security, performance, and formatting.
If your team is already utilizing industry-leading BI tools, you don’t need to rebuild your dashboards or migrate your data. With Embedportal, you can embed your entire BI stack — including Tableau, Power BI, QuickSight, and Metabase — inside one beautifully branded, fully white-labeled portal in under an hour.
We provide a secure, unified embedding layer that handles row-level security, tenant-aware branding, and single sign-on without ever moving or storing your underlying data.
Stop wasting precious engineering resources on manual reporting. Let us show you how easy it is to deliver a world-class analytics experience to your customers. Ready to see it in action? Explore our solutions for Embedded BI and start building today.