
Know which dashboards get used, by whom, and what changed
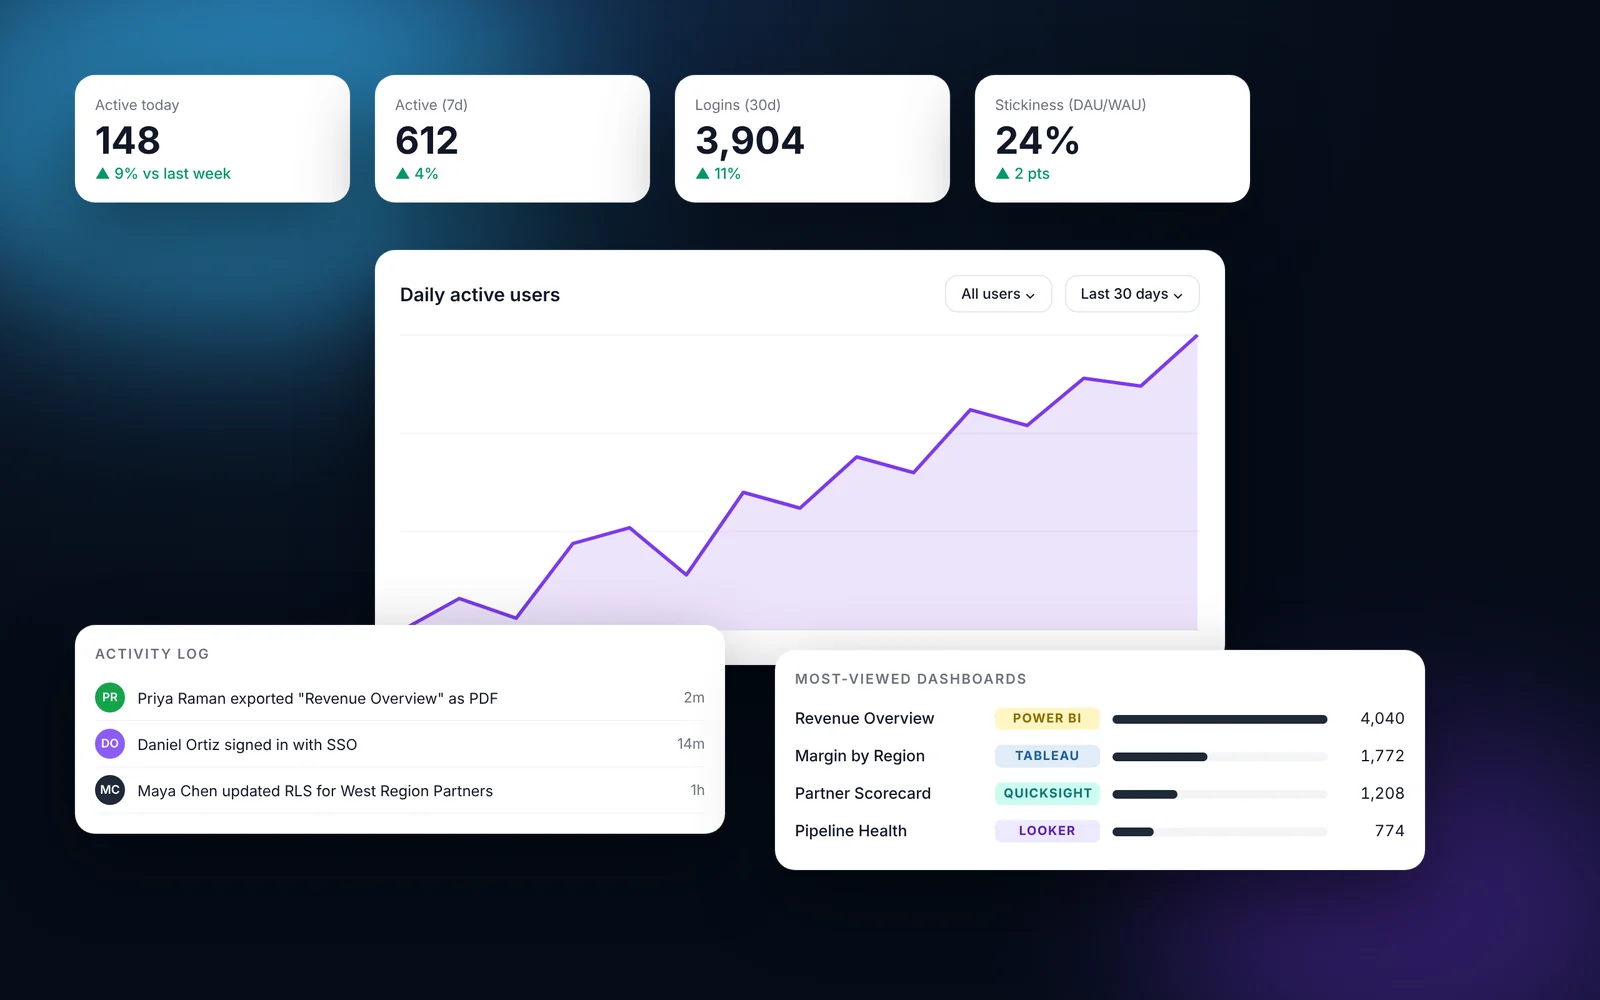
Usage analytics shows active users today and over seven days, logins, stickiness (DAU/WAU), login outcomes per day and the most-viewed dashboards with renders and unique viewers. The activity log records events such as logins, exports and admin changes, so you can answer who did what and when.
How it works
Most teams finish these steps in under an hour.
Open Usage Analytics
Go to Usage Analytics in the admin.
Filter
Choose all users or a specific user, and a date range such as the last 30 days.
Review the top dashboards
See renders and unique viewers for each dashboard.
Check the activity log
Open Activity Logs to see individual events such as exports and logins.
What it looks like in EmbedPortal

Usage analytics and audit logs features
Active users
Today, last 7 days and across the selected window.
Stickiness
DAU/WAU shows how often people come back.
Login outcomes
Successful and failed logins per day.
Most-viewed dashboards
Renders and unique viewers, across every BI tool.
Activity log
Exports, logins, impersonation and admin changes.
Capacity planning
Use render counts to size Power BI or QuickSight capacity.
Why usage data matters
If you pay for BI capacity, you want to know which dashboards earn it. Usage analytics tells you what to improve and what to retire.
The activity log gives security and compliance teams a record of access and exports.
Common questions
Can I see which embedded dashboards customers use most?
Yes. Usage analytics lists the most-viewed dashboards with renders and unique viewers.
Is there an audit log?
Yes. The activity log records events such as logins, exports and impersonation sessions.
Can I filter usage by user?
Yes. Filter by a single user or all users and pick the date range.
Share your first dashboard this week.
Connect your BI tool, set up groups and row-level security, and invite viewers. One flat price with unlimited viewers.