Embed BI Dashboards Like a Pro: A Developer’s Guide
Why Embedding BI Dashboards Is Now a Core Product Decision
If your team needs to embed BI dashboards into a customer-facing product, you already know the problem: it takes longer than it should, looks messier than it should, and breaks more often than it should.
Here’s a quick answer to the core question – what are the main ways to embed BI dashboards?
The main approaches to embed BI dashboards:
- iframe embedding – paste an embed URL into an iframe tag; fastest to ship, least control
- JavaScript SDK – use a BI vendor’s SDK for programmatic control over tokens, filters, and layout
- REST API + custom frontend – fetch data via API and render with your own components; most flexible, most expensive to build
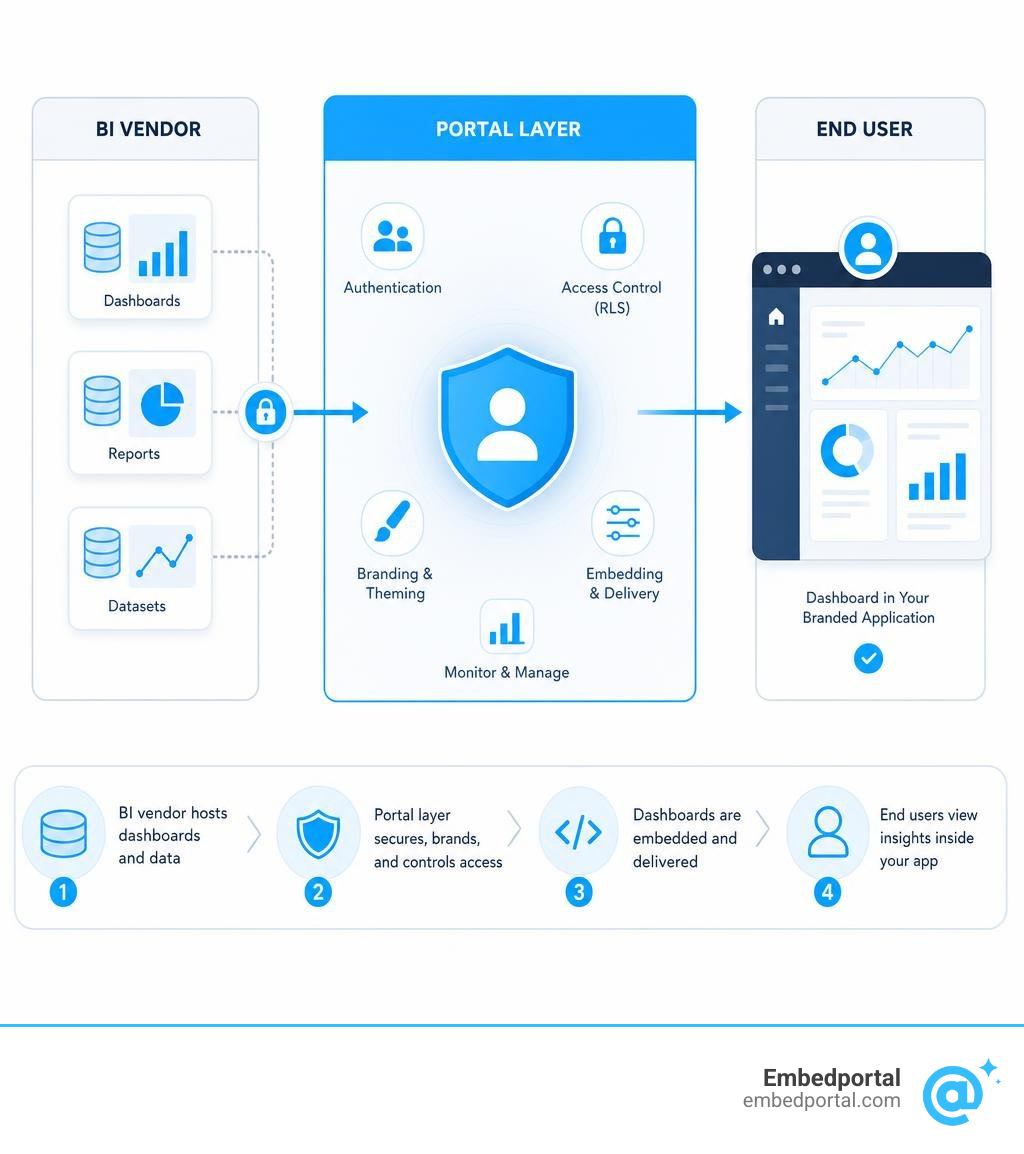
- Multi-vendor portal – a layer like Embedportal that sits in front of your BI tools and handles auth, RLS, and branding in one place
Most analytics or product leads start with one BI tool and one iframe. Then the product grows. Suddenly there are multiple analytics systems, five enterprise tenants, inconsistent branding, and a row-level security setup that nobody fully understands.
The problem isn’t embedding a single dashboard. The problem is doing it cleanly, at scale, across vendors – without rebuilding your auth layer every time.
One estimate puts the traditional custom-build timeline at 6 to 8 weeks minimum before a customer-facing dashboard is live. That’s weeks of query layers, token management, multi-tenancy logic, and visual theming – before you’ve written a single line of product code.
This guide covers the full picture: technical approaches, security patterns, white-labeling, and which tools actually make this tractable.
Why Modern Applications Embed BI Dashboards
Building analytics into your software is no longer a luxury. In 2026, SaaS buyers expect polished, interactive reporting directly inside their workflows. The classic “export to CSV” button is no longer enough. However, product teams face a massive architectural fork in the road: do you build these visualizations from scratch, or do you integrate an Embedded BI system?
To understand the trade-offs, we must look at what it actually takes to build a custom visualization layer versus embedding an established business intelligence engine. The choice between using pre-built embedded analytics and custom-built dashboards highlights how quickly a “simple” home-grown charting project can balloon into a full-time infrastructure headache.
| Feature | Custom-Built Dashboards | Embedded BI Dashboards |
|---|---|---|
| Time-to-Market | High (6–8 weeks for basic charts, months for full interactive BI) | Low (Days to under an hour with the right platform) |
| Maintenance Overhead | Extremely High (Your engineers own every bug, rendering issue, and data connector) | Low (Managed by the BI vendor or embedding platform) |
| User Engagement | Low to Medium (Hard to build advanced features like drill-downs and scheduled exports) | High (Includes native interactive filtering, scheduling, and AI-driven insights) |
| Data Accessibility | Limited (Requires writing custom APIs for every new query type) | Unlimited (Connects directly to your data warehouse or BI semantic layer) |
| Initial Cost | High developer salary costs | Predictable licensing or platform fees |
When you build from scratch, you aren’t just writing React components. You are building a query optimization engine, a caching layer, a user access control matrix, and a responsive layout system. By choosing to embed bi dashboards instead, you bypass the infrastructure work. Your team can focus on your core product value while relying on a dedicated Embedded Analytics Platform to deliver the reports.
This shifts the focus from data engineering to user experience. Rather than spending sprints fixing rendering bugs on mobile Safari, your developers can plug in pre-built, highly optimized dashboard components that adapt to user needs.
Technical Approaches to Dashboard Embedding
When developers set out to embed analytics, they generally look at three primary technical patterns. Each has its place, depending on your timeline, security requirements, and the level of customization your product demands.
The simplest approach is direct iframe integration. You generate a secure share link from your BI tool and drop it into an iframe element within your application. While this works for quick internal portals, it has massive limitations. You cannot easily pass variables back and forth between the parent application and the iframe, and custom styling is highly restricted. As we like to say, The Iframe is the Easy Part What Embedded Analytics Needs is a comprehensive wrapper that handles authentication, dynamic filtering, and performance.
The second approach is a programmatic JavaScript SDK. Most major BI vendors provide an SDK that allows you to load, control, and interact with dashboards through code. This gives you deep programmatic control, allowing your application to listen to events inside the dashboard, such as a user clicking a data point, and trigger actions in your main software.
The third approach is using RESTful APIs to fetch raw data or pre-rendered visual assets and display them in a custom UI. This is highly flexible but requires significant development work to maintain.
Regardless of the approach, mobile responsiveness and performance optimization are critical. Embedded dashboards are notorious for heavy payloads. If you load a massive iframe with dozens of unoptimized queries, your application’s load time will suffer. You must implement lazy loading, query caching, and smart rendering strategies to keep your app fast.
How to Embed BI Dashboards via JavaScript SDK
For teams using a programmatic approach, the JavaScript SDK is the standard tool. To understand the broader implementation model, refer to the official embedded analytics SDK documentation.
When using a JavaScript SDK, you don’t just point your application to a URL. Instead, you initialize the embed by passing a highly structured configuration object to the SDK. In many embedded analytics implementations, this configuration object defines the dashboard asset, the secure token, and the rendering behavior.
To implement secure BI dashboard embedding, your frontend application must receive several key properties from your secure backend:
- accessToken: A temporary, cryptographically signed token that proves the user has permission to view this specific dashboard.
- embedUrl: The specific vendor URL where the dashboard asset is hosted.
- id: The unique identifier of the dashboard.
- tokenType: Specifies whether you are using identity-provider authentication for a user-owned data model or an embed token for an app-owned data model.
- pageView: Controls how the dashboard fits into its container. Options often include fit-to-width rendering, single-column mobile layouts, and preserving the original canvas dimensions.
By loading the dashboard programmatically, your app can dynamically update filters, switch views, and handle token expiration in the background without forcing a full page reload.
Embedding Dashboards vs. Individual Widgets
Another technical decision is whether to embed an entire multi-tab dashboard or target individual widgets, also called tiles.
Embedding a full dashboard is generally the preferred path when you want to give users a self-contained, interactive reporting workspace. It handles layout, tab navigation, and cross-filtering between charts automatically.
However, if you want a tight, native-looking UI, such as displaying a single KPI metric on a user’s main account overview page, you should embed individual widgets. Many BI platforms allow you to activate a specific widget mode or use a unique widget ID in your embed URL.
While embedding individual widgets gives you precise layout control, it comes with a performance overhead. If you place five individual iframes on a single page to display five different charts, your browser must open five separate connections and load the BI engine’s runtime five times. This can quickly bog down your application. For a seamless user experience, embedding a single, well-designed dashboard is usually cleaner and more performant.
Security, Authentication, and Row-Level Security (RLS)
Security is the single most complicated part of embedding dashboards in customer-facing software. When you build Embedded Analytics for SaaS, you are displaying sensitive business data. You must guarantee that Tenant A can never, under any circumstances, see the data belonging to Tenant B.
To achieve this, you need a robust security architecture that spans authentication, single sign-on (SSO), and Row Level Security.
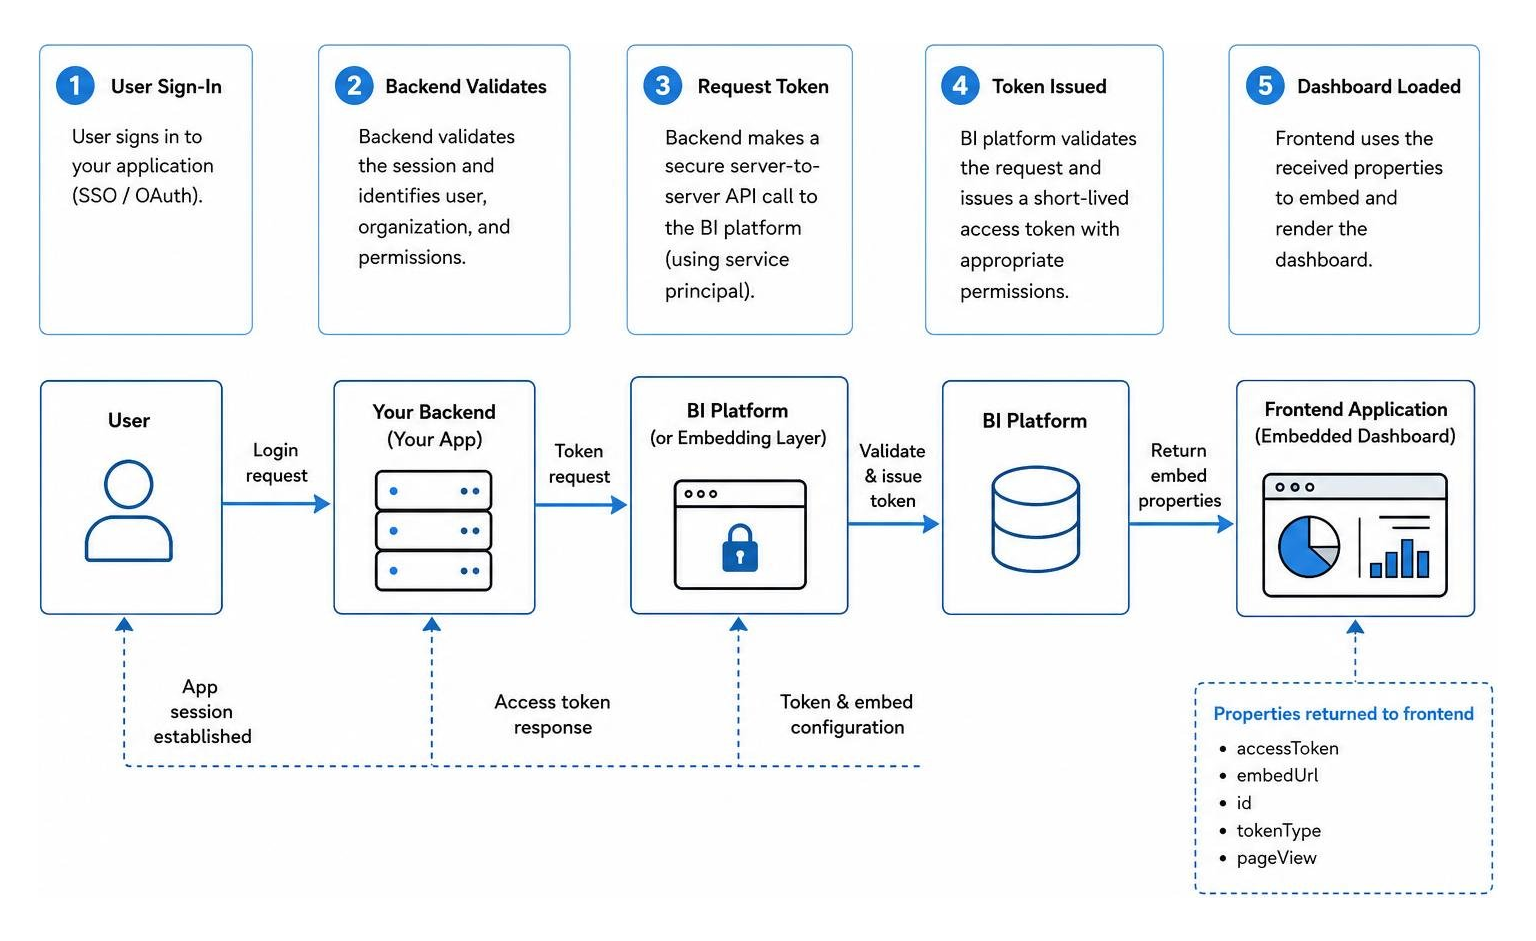
The standard security flow works like this:
- Your user logs into your SaaS application using your standard identity provider (SSO, OAuth, etc.).
- Your backend validates the user’s session and identifies their organization and data access permissions.
- Your backend makes a secure server-to-server API call to your BI platform (or your embedding layer) using a high-privilege service principal.
- Your application requests a short-lived, scoped embed token. This request includes specific Multi-Tenant Row Level Security parameters, telling the database exactly how to filter the data for this user.
- The BI platform returns the signed token to your backend, which forwards it to the frontend.
- The frontend JavaScript SDK uses this scoped token to render the dashboard securely.
This “app owns data” model means your customers do not need their own individual BI tool accounts. Your application acts as the trusted gatekeeper, using a single service principal to authenticate all data queries on behalf of your users.
Securely Managing Tokens to Embed BI Dashboards
To keep this architecture secure, you must manage your tokens with extreme care. You should never expose high-privilege API keys or master database credentials to the client side.
When generating token-based SSO embeds, modern data platforms rely on cryptographically signed URLs. The signature is typically generated using an HMACSHA256 algorithm that combines your embed parameters (such as the user’s email, tenant ID, and timestamp) with a secret key.
Here are the essential parameters used to secure these URLs:
- embed_nonce: A random, unique string (such as a GUID) generated for each request. This prevents replay attacks, where a malicious actor attempts to reuse an old URL.
- embed_timestamp: The exact time the URL was generated.
- embed_expirationtime: The lifespan of the signature, typically ranging from 86,400 to 518,400 seconds (or much shorter, such as 5 minutes, for highly secure environments). If you do not specify an expiration time, some generated signatures remain valid indefinitely, which poses a security risk.
- embed_signature: The final HMACSHA256 hash that validates the request has not been tampered with.
Always perform your token generation and user access validation server-side. By keeping your secrets hidden in your environment variables, you ensure that malicious users cannot modify the token parameters to access other tenants’ data.
Best Practices for White-Labeling and Multi-Tenant Analytics
To make your embedded dashboards look like a native part of your software, you need comprehensive white-labeling. If your application has a sleek, dark-themed UI, loading a bright white dashboard with standard BI vendor logos will disrupt the user experience.

True White Label Analytics involves several layers of customization:
- Theming and Colors: Match the dashboard’s color palette, charts, background, and fonts to your application’s design tokens.
- CSS Injection: Many embedding tools allow you to inject custom stylesheets to hide native headers, navigation sidebars, and export buttons that you don’t want your users to see.
- Localization: Ensure the dashboard dynamically adapts to the user’s preferred language and number formatting based on their application settings.
In addition to visual white-labeling, you must design for Multi-Tenant Analytics. In a multi-tenant setup, different customers might have their data stored in completely different databases or database schemas.
To handle this without building a separate dashboard for every single customer, you should use dynamic connection strings. This feature allows your application to swap out the underlying database connection at runtime based on the logged-in user’s token. When Tenant A loads the dashboard, the BI engine connects to Tenant A’s database schema; when Tenant B loads it, the engine seamlessly routes queries to Tenant B’s database.
Frequently Asked Questions about Dashboard Embedding
Can you embed a BI dashboard in a website?
Yes, you can embed a BI dashboard in a website, but the method you choose depends on whether the data is public or private.
For public data, such as a local government budget tracker or a public research project, some tools allow a simplified publish-to-web option. However, there are major limitations to this approach. Certain dashboard asset types do not support simple public embed codes, even on higher-tier licenses.
For secure, private websites, you must use an authenticated embedding architecture. This requires a backend server to generate secure tokens so that only logged-in, authorized users can view the data. If you need to embed a specific report instead, you can look into how to embed reports securely using a JavaScript SDK.
How do you handle external user access without individual BI accounts?
You handle this using an app-owns-data or service principal model. Instead of buying a BI tool license for every single one of your customers, your application authenticates with the BI platform using a single, high-privilege developer account, also known as a service principal.
When an external user requests a dashboard, your backend generates a scoped embed token on their behalf. The BI tool only charges you for the server capacity, compute, or flat embedding fee, rather than a per-user license. This approach keeps your costs predictable and allows you to scale to thousands of external viewers. For more details on managing these permissions, read about external users in embedded analytics and managing guest access for embedded dashboards securely.
What are the main performance limitations of embedded dashboards?
The most common performance bottleneck is iframe overhead. Browsers struggle to render multiple heavy iframes simultaneously. If your embedded dashboard contains dozens of complex queries, it will load slowly and degrade your application’s user experience.
To combat this, use query optimization techniques, implement aggressive data caching, and utilize bootstrap methods provided by BI SDKs. Bootstrapping allows you to initialize and prepare the iframe container on the page before the secure access token is even generated, shaving seconds off the perceived load time. Additionally, make sure your dashboards are designed with mobile responsiveness in mind, automatically collapsing into a single-column layout on smaller screens.
Conclusion: Embed BI Dashboards in Under an Hour
Embedding analytics doesn’t have to be a multi-month engineering project. While the traditional route of managing SDKs, writing custom token-generation services, and configuring row-level security for each individual vendor can take weeks, there is a faster way.
At Embedportal, we built a white-label embedding platform designed specifically to solve this problem. Instead of building complex data pipelines or rewriting your authentication layer, Embedportal acts as a unified glass layer in front of the BI tools you already own.
Whether you are standardizing one BI environment or supporting multiple analytics vendors, we allow you to:
- Embed multi-vendor dashboards inside a single, beautifully branded portal.
- Define row-level security rules once and automatically forward them to each vendor’s native RLS mechanism.
- Set up secure SSO and tenant isolation in under an hour, using a simple JSON configuration and a drop-in component.
- Keep your data where it is – we don’t store, move, or ingest your data; we only route secure tokens and render your existing dashboards cleanly.
If you are ready to ship professional, secure, and fully white-labeled analytics to your customers this week, we are here to help.
Check out our Embedded BI solutions, explore our Pricing, or sign up for a Demo today. Let’s build something great together – without the engineering headache.