No More Third-Party Logos: A Guide to Branded Reporting Embedding
Why Your Customers Shouldn’t See Anyone Else’s Logo in Your Product
Branded BI embedding is the practice of embedding data dashboards and analytics directly inside your own product – fully styled with your colors, fonts, and domain – so users never see a third-party vendor’s logo or UI.
Here’s a quick breakdown of what that means in practice:
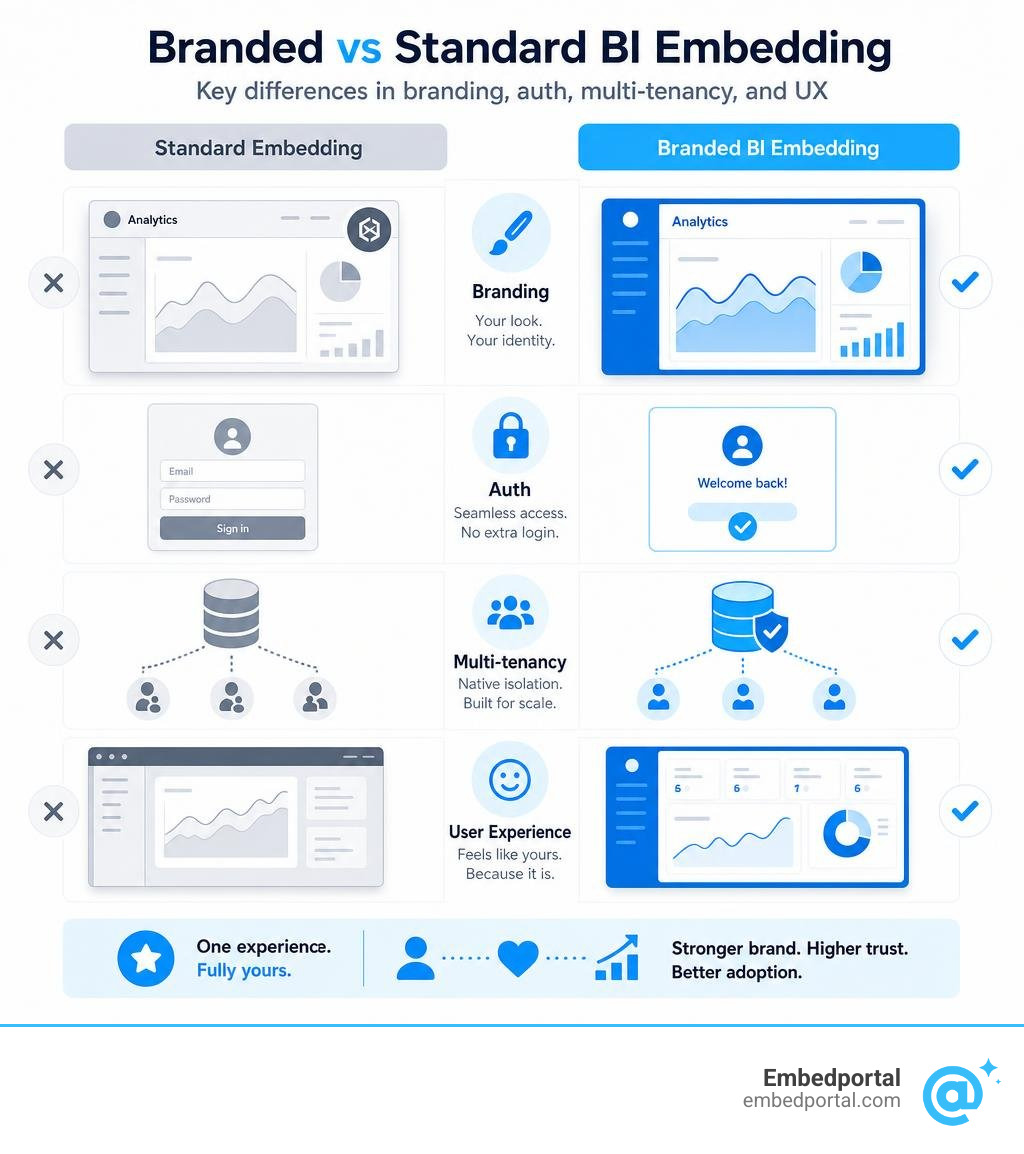
| Standard Embedding | Branded BI Embedding | |
|---|---|---|
| Vendor logo visible | Yes | No |
| Matches your product’s UI | Rarely | Always |
| SSO / no second login | Often missing | Built-in |
| Multi-tenant data isolation | Manual workarounds | Native |
| User feels inside your product | No | Yes |
If you’re a product or analytics lead at a SaaS company, you’ve likely run into this problem: you embed a third-party dashboard via iframe, and suddenly your customers are staring at another vendor’s brand elements inside your product. It breaks the experience. It signals that the feature was bolted on, not built in.
And the stakes are real. Research consistently shows that in-product analytics drives 2-3x higher adoption compared to standalone BI tools. Meanwhile, traditional BI tools see adoption rates outside the core data team run at just 30-40%.
The gap between those two numbers? That’s what branded embedding closes.
What is Branded BI Embedding vs. Standard Analytics?
To understand how to elevate your user experience, we first need to draw a clear line between standard embedding and true White Label Analytics.
Standard embedding is the quickest, most basic way to get a chart into an application. It usually involves copying a public or semi-private iframe URL from your BI tool and pasting it into your application code. While this gets the data on the screen, it brings along a massive amount of platform baggage. Your users are greeted with third-party headers, gray navigation bars, export buttons that do not work, and prominent watermarks.
True white-label BI is a completely different philosophy. It is about making the third-party BI platform completely disappear. When you implement branded bi embedding, the reporting interface is restyled to match your application’s exact design system. The fonts align, the color palettes match your brand, and the domain name is yours.
By removing third-party logos, you build immediate user trust. When customers see a cohesive, unified interface, they perceive your application as a premium, high-value product that built its analytics from scratch. For a deep dive into what you actually get when you commit to this level of customization, check out our guide on White Label Analytics.
Why Traditional BI Tools Fall Short for SaaS Products
Traditional business intelligence platforms were never built for external, customer-facing use cases. They were designed in the early 2010s for internal business analysts who needed to build reports for their executive teams.
When you try to force these internal-facing platforms into a SaaS product, you run into three massive walls:
- Licensing Complexity: Traditional tools charge on a per-user basis. If you have 5,000 users in your SaaS application, paying $10 to $15 per user per month for a BI license is a financial non-starter.
- Vendor Lock-In: Legacy BI engines want to pull you deeper into their specific cloud ecosystems. If you build your entire analytics stack on one vendor, migrating or offering multi-vendor reports down the road becomes a nightmare.
- Branding Restrictions: Legacy platforms make it incredibly difficult to hide their identity. Even if you pay for premium tiers, you often cannot fully hide their distinct UI elements, CSS structures, or loading spinners.
If you are currently evaluating how to strip these limitations from your reporting, look into our dedicated resources on white-label reporting for one common BI stack and white-label reporting for another enterprise BI stack.
Limitations of Legacy Embedded Capacities
Even when legacy vendors offer developer-specific embedding options, like the embedded analytics developer overview, they carry complex infrastructure requirements.
Legacy developer capacities rely on complex pricing models tied to node sizes and page renders. For example, under a capacity-based model, you pay for dedicated cloud resources across capacity tiers. Every time a user clicks a filter, loads a page, or switches a tab, it counts as a page render. If your application experiences a sudden spike in traffic, your dashboards can slow down or fail completely unless you manually scale up your capacity, which instantly balloons your monthly cloud bill.
Furthermore, basic BI embedding relies heavily on standard iframes. These iframes act as isolated windows inside your app. They do not communicate naturally with your application’s state, making it incredibly difficult to build interactive features, like having a click on a dashboard element trigger a native action inside your SaaS platform.
The Strategic Value of Branded BI Embedding in 2026
As we navigate July 2026, the SaaS landscape is more crowded than ever. Customers no longer view analytics as a nice-to-have add-on; they view it as a core component of the product. Delivering a disjointed reporting experience directly harms your retention rates.
When you invest in true SaaS BI Embedding, you are not just showing charts; you are increasing the perceived value of your software. When analytics feel native, users spend more time inside your platform, turning your application into their single source of truth. This tight product integration is the key to driving higher customer lifetime value (LTV) and reducing churn. For more on this trend, read about Embedded Analytics for SaaS.
Driving 2-3x Higher Adoption Rates
Why do standalone BI tools suffer from low adoption? It comes down to friction. Asking a non-technical customer to log into a separate portal, learn a complex interface, and manually filter data results in an adoption rate of only 30-40%.
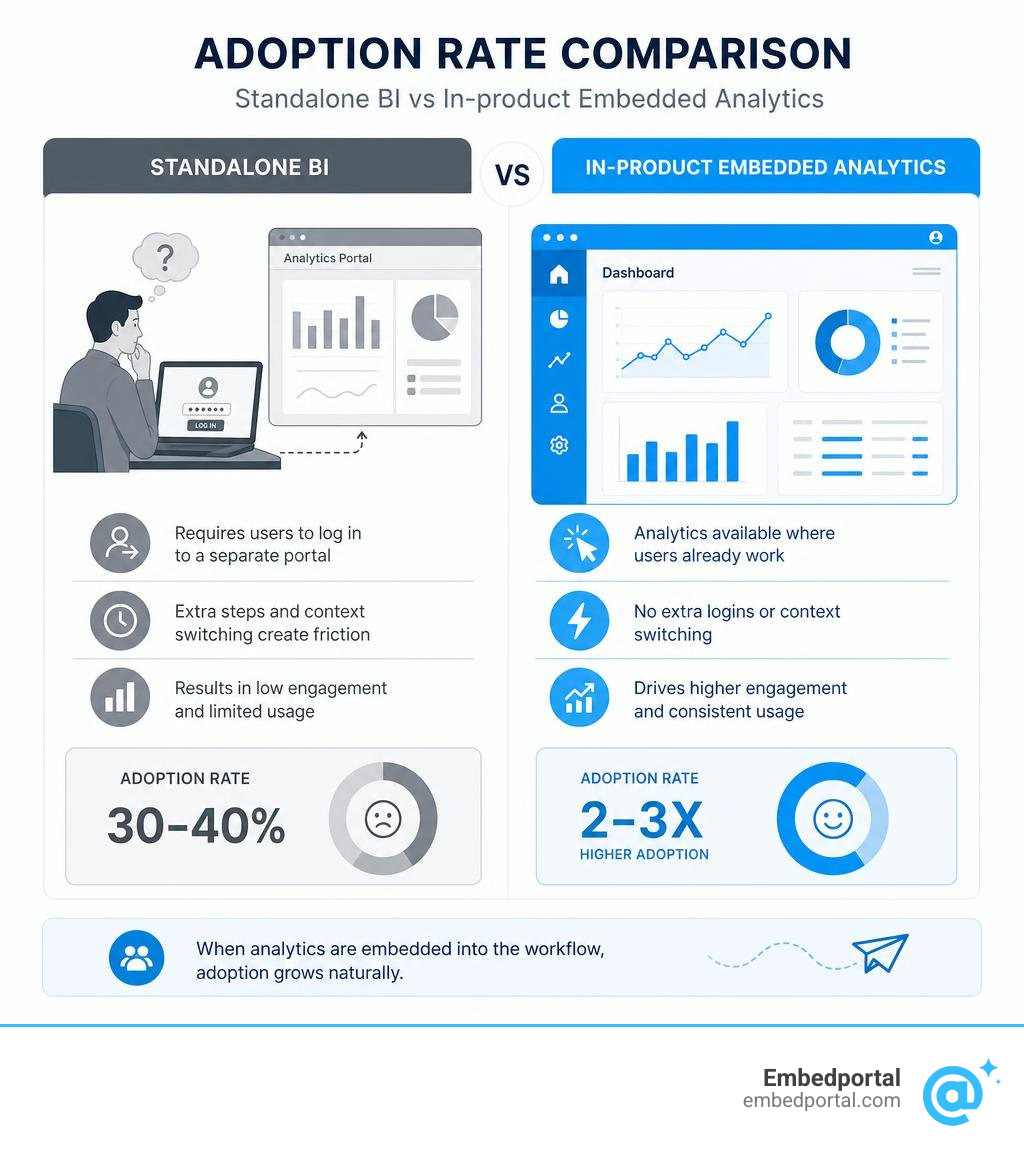
When you bring analytics directly into the user’s workflow via Embedded Analytics, adoption rates skyrocket by 2-3x. Users do not have to think about opening a report. The data they need to make decisions is right there, integrated into the screens they already use to do their daily work.
Lowering Total Cost of Ownership (TCO)
When SaaS teams realize legacy BI tools do not support proper branding, they often think, let’s just build it ourselves from scratch using open-source charting libraries.
This is almost always a costly mistake. Building a custom visualization engine requires months of developer time, and the work never truly ends. You have to build the charting library, the data connectors, the caching layer, the row-level security, and the user management system.
Here is how building from scratch compares to utilizing a modern branded bi embedding platform:
| Feature / Metric | Custom-Built Analytics | Branded BI Embedding Platform |
|---|---|---|
| Time to Market | 6 to 18 months | Under 2 to 4 weeks |
| Upfront Dev Cost | $100,000 – $250,000+ | Minimal setup cost |
| Ongoing Maintenance | High (requires dedicated engineers) | Low (handled by platform) |
| Feature Requests | Backlogged and slow to build | Instant (drag-and-drop builders) |
| Multi-Vendor Support | Impossible without rebuild | Native and unified |
Technical Architecture and Capabilities for True White-Labeling
To achieve a seamless, fully branded analytics experience, your underlying architecture must be secure, scalable, and completely invisible to the end user.
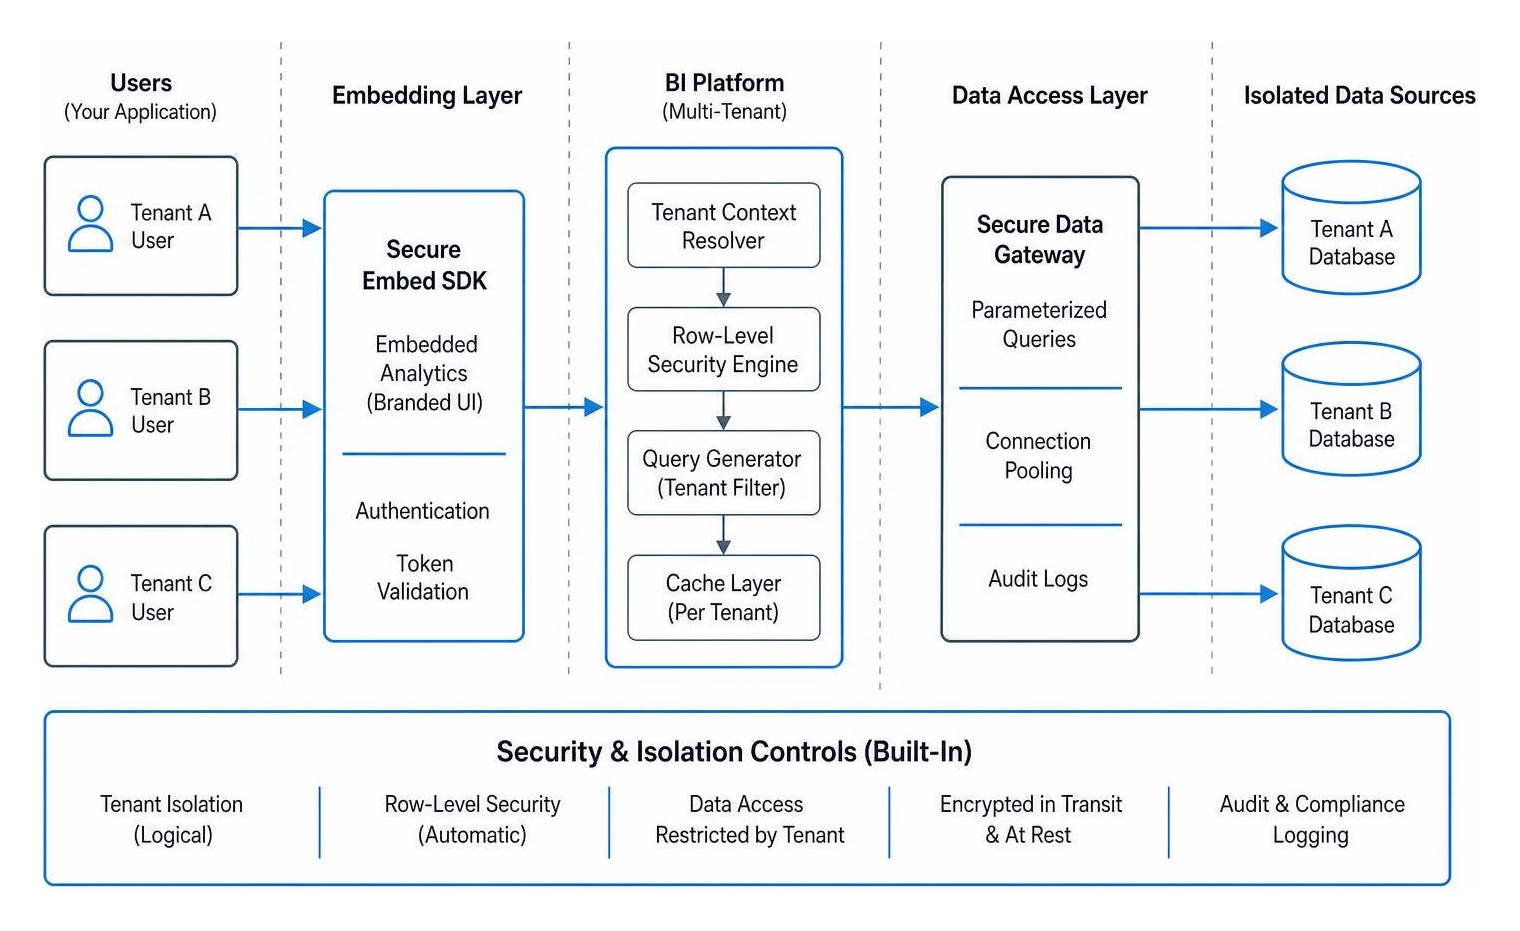
A modern Embedded Analytics Platform must handle data isolation and secure user access without forcing you to manage complex database schemas for every new customer.
Key Technical Requirements for Branded BI Embedding
To deliver a secure and beautifully integrated reporting experience, your embedding solution must check five critical boxes:
- Single Sign-On (SSO): Users should log into your application once. The embedded dashboard must authenticate silently in the background so users are never prompted for a second username or password.
- Row-Level Security (RLS): This ensures that Tenant A can only see Tenant A’s data, while Tenant B only sees Tenant B’s data, all while using the exact same dashboard template.
- Multi-Tenancy: The system must dynamically filter data based on the active user’s organization, role, and permissions.
- Custom CSS & Theming: You must have the ability to inject custom stylesheets to override default colors, borders, fonts, and button styles.
- Custom Domains: The dashboard assets should load from a white-labeled subdomain (e.g.,
analytics.yourcompany.com) rather than a third-party domain.
Content vs. Application Integration in Branded BI Embedding
There are two primary ways to integrate dashboards into your application: Content Integration and Application (Composable) Integration.
Standard content integration relies on basic iframes. While simple to set up, it limits your branding capabilities. You cannot easily change the layout of the dashboard dynamically, and you cannot easily pass actions between the dashboard and your application.
Application integration, or composable embedding, uses JavaScript SDKs and secure APIs. Instead of embedding an entire foreign page, you load individual visualization components directly into your application’s DOM. This allows you to build custom front-ends where the charts look and behave like native React, Vue, or Angular components. If you are currently working with an existing BI stack, learning how to cleanly embed a report without the iframe clutter is a vital step toward this level of integration.
Implementation Challenges and Best Practices
Transitioning to a white-labeled reporting model comes with its own set of technical hurdles. If you do not plan ahead, you can run into slow page loads, data synchronization delays, and frustrated developers.

By choosing a modern Embedded BI approach, you can bypass these hurdles and keep your engineering team focused on your core product features.
Overcoming the Analyst Bottleneck
In many SaaS companies, every new dashboard request or layout change has to go through a developer. This creates a massive bottleneck.
To solve this, look for platforms that decouple dashboard creation from application deployment. By using a white-label platform that supports no-code dashboard builders, your product managers, customer success teams, or data analysts can build and update reports. Once the initial secure embed code is placed in your application, any changes made in the dashboard builder update automatically for your customers—no code deployments required.
Best Practices for Seamless Multi-Tenant Deployment
When deploying branded dashboards to hundreds of clients, keep these three best practices in mind:
- Use Token-Based Authentication: Generate short-lived, secure JWT tokens on your backend to pass user identity and security roles to the embedded dashboard.
- Implement Dynamic Filtering: Do not build separate dashboards for different clients. Build a single master dashboard and use your embedding platform to apply dynamic filters based on the authenticated tenant ID.
- Automate Tenant Provisioning: Ensure that when a new customer signs up for your SaaS product, your analytics platform automatically provisions their data access rules via API.
Frequently Asked Questions about Branded Analytics
How does branded BI embedding impact application performance?
Because embedded dashboards load external assets, they can occasionally slow down your page load times if not configured correctly. To prevent this, our platform uses aggressive caching, global CDNs, and optimized query routing. This ensures that your dashboards load in milliseconds, keeping your core application fast and responsive.
Can we achieve true white-labeling without any third-party logos?
Yes. True white-labeling completely strips out all vendor watermarks, loading animations, help menus, and copyright text. By utilizing custom CSS injection and custom subdomains, your customers will have absolutely no way of knowing that a third-party engine is powering the charts.
What is the typical timeline to deploy a branded dashboard?
While building a custom solution takes months, and configuring legacy developer capacities takes weeks of API integration, purpose-built platforms can get you up and running incredibly fast. With the right tooling, you can embed your first fully branded, secure dashboard in under an hour.
Conclusion
Providing data insights to your customers shouldn’t mean compromising your brand’s identity. Traditional BI tools force you into rigid licensing models, complex developer capacities, and disjointed user experiences.
With Embedportal, we have built a SaaS platform that completely redefines embedded analytics. Based in California, USA, we enable product and engineering teams to embed multi-vendor analytics from the BI tools they already use with unified branding, robust row-level security, and seamless SSO in under an hour.

Stop letting third-party logos clutter your application. Deliver the clean, native, and secure reporting experience your customers deserve.
Get started with Embedportal’s Embedded BI Platform today and take full control of your product’s analytics experience.