Scale Your Insights with a Modern Enterprise Analytics Platform
Why Every Data-Driven Organization Needs an Enterprise Analytics Platform
An enterprise analytics platform is a unified system that connects data ingestion, transformation, analysis, and decision-making into a single governed environment — going far beyond what traditional dashboards or standalone BI tools can offer.
If you’re evaluating options, here’s the short answer:
What is an enterprise analytics platform?
- A centralized software environment that collects data from multiple sources
- Transforms raw data into business insights using descriptive, diagnostic, predictive, and prescriptive analytics
- Supports real-time reporting, machine learning, and AI-driven automation
- Enforces governance, security, and access control across all users and teams
- Scales across cloud, on-premises, or hybrid infrastructure
The volume of data organizations generate is enormous — and growing. Companies expect their data to increase by 22% on average over the next 12 months. Most organizations are already drowning in it.
The problem isn’t collecting data. It’s turning it into decisions, fast enough to matter.
For analytics and product leads — especially those managing embedded dashboards across multiple BI tools — the challenge is even sharper. Fragmented data, inconsistent security models, and mismatched branding across vendor tools slow everything down.
An enterprise analytics platform is designed to fix exactly that.
What is an Enterprise Analytics Platform?
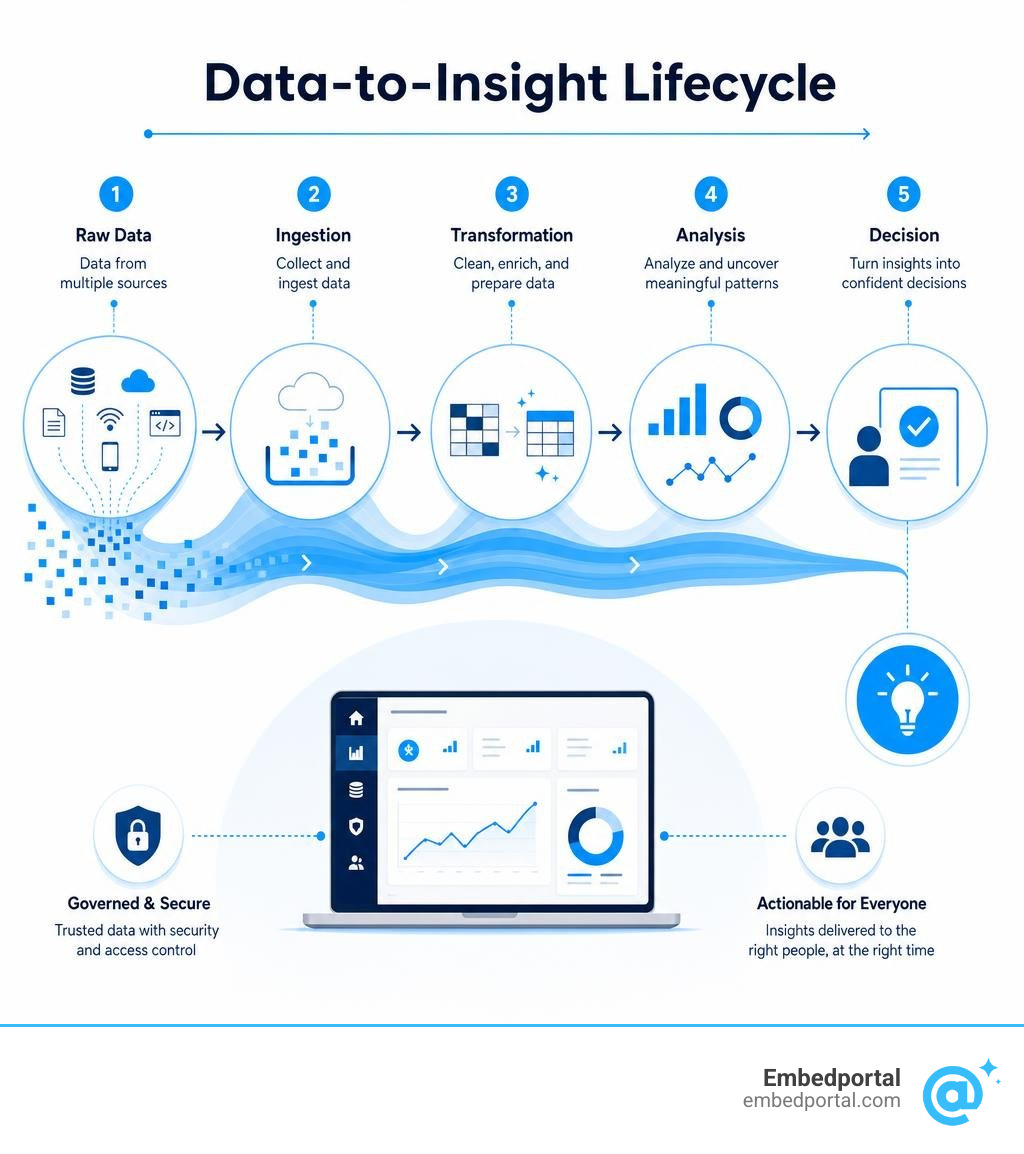
At its core, an enterprise analytics platform is more than just a reporting tool. It is a comprehensive framework designed to manage the entire data journey—from the moment a user clicks a button on your application to the moment an executive makes a high-stakes strategic decision.
Unlike single-purpose SaaS analytics tools, an enterprise platform unifies your entire organization’s data footprint. It breaks down walls between departments, ensuring that marketing, product, finance, and operations are all looking at the exact same numbers. By serving as a single source of truth, it mitigates the chaos of “data brawls”—those awkward weekly meetings where three different team leads present three different numbers for the same key metric.
To understand how these systems operate at scale, it helps to read a full breakdown of their operational capabilities. For a deeper dive into the fundamental definitions, check out the guide on Enterprise Analytics Platforms: everything you need to know.
Traditional BI vs. a Modern Enterprise Analytics Platform
Historically, business intelligence (BI) was a linear, backward-looking process. You took highly structured, clean data from a relational database, ran a batch ETL (Extract, Transform, Load) job overnight, and output a static PDF report or a basic dashboard the next morning. It was descriptive—it told you what happened yesterday, but nothing more.
A modern enterprise analytics platform fundamentally reimagines this workflow. Instead of acting as a passive visualization layer, it manages the entire end-to-end decision lifecycle.
Here is how the two approaches compare:
- Data Inputs: Traditional BI requires rigid, pre-structured relational tables. Modern platforms ingest unstructured, semi-structured, and real-time streaming data, ranging from raw JSON payloads to customer service PDFs and IoT sensor logs.
- Analytics Lifecycle: Traditional BI stops at visualization. Modern platforms seamlessly integrate machine learning (ML) model development, predictive forecasting, and automated actions directly into the same workspace.
- User Experience: Traditional BI is built for specialized data analysts who write SQL. Modern platforms democratize data access, offering search-driven interfaces and natural language query tools so business users can build their own reports safely.
- Actionability: Rather than requiring a human to view a dashboard and manually update another system, modern systems use APIs and webhooks to trigger automated business workflows based on real-time data thresholds.
For organizations that want to deliver these capabilities directly to their own customers, integrating these modern features is crucial. You can read more about how this paradigm shifts when you bring these insights directly into your customer-facing software in our guide to Embedded BI.
The Evolution from Static Dashboards to AI-Driven Decision Engines
Enterprise analytics has gone through several distinct phases over the past two decades. We have transitioned from rigid, centralized reporting environments to dynamic, decentralized platforms where AI and humans collaborate in real time.
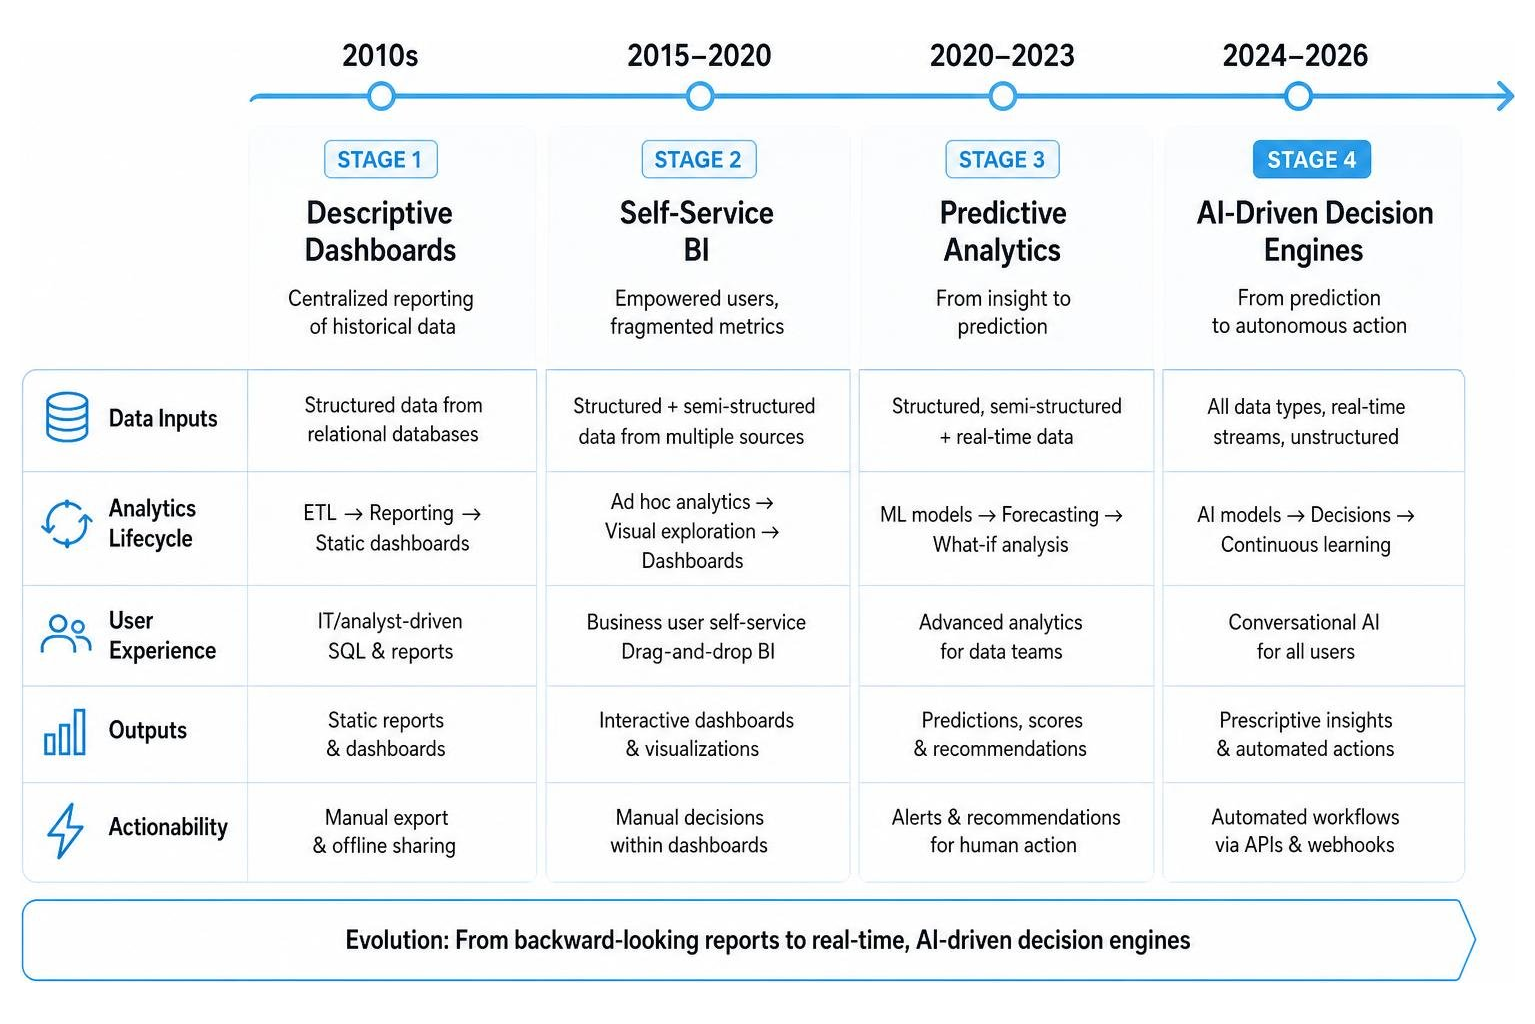
Let’s look at the four key stages of this evolution:
- Stage 1: Descriptive Dashboards (The 2010s): This era was dominated by centralized IT teams building static dashboards. Business users had to file IT tickets to get a new chart or filter added, resulting in weeks of backlog and stale data.
- Stage 2: Self-Service BI (2015–2020): Tools emerged that allowed non-technical users to drag and drop fields to build their own visualizations. While this democratized access, it often led to “dashboard sprawl” and fragmented metric definitions, as every department calculated KPIs differently.
- Stage 3: Predictive Analytics (2020–2023): Platforms began integrating machine learning models directly into the BI layer. Instead of just showing past sales, platforms started predicting next quarter’s revenue and identifying churn risks before they happened.
- Stage 4: AI-Driven Decision Automation (2024–Present/2026): The modern era is defined by autonomous decision engines. Today, platforms don’t just predict that a supply chain disruption is coming; they automatically reallocate inventory across regional warehouses to minimize the impact, governed by guardrails set by business leaders.
The Role of Agentic AI in a Modern Enterprise Analytics Platform
The most significant shift in 2026 is the rise of agentic analytics. Traditional AI in BI was passive—you asked a question, and it generated a SQL query or a chart. Agentic AI, however, uses autonomous AI agents that proactively monitor your data, coordinate complex workflows, and deliver ready-to-use insights.
Rather than waiting for you to log in and find an anomaly, an AI agent can:
- Identify an unexpected dip in conversion rates for a specific product category.
- Query multiple data sources to find the root cause (e.g., a broken checkout page on mobile devices running a specific OS version).
- Draft a detailed incident report and automatically assign a ticket to the engineering team.
- Generate a localized promotion to win back impacted customers once the bug is fixed.
This shift to decision intelligence means your data works for you, not the other way around. Leading platforms like Pyramid Analytics: Business & Decision Intelligence Platform … are pioneering this space, blending data preparation, advanced analytics, and AI-driven data science into a single, cohesive workflow.
Core Capabilities of Modern Analytics Architectures
To support these advanced AI and automated capabilities, a modern enterprise analytics platform relies on a highly sophisticated architectural foundation. It is no longer enough to connect a dashboard directly to a production database.
A robust enterprise architecture includes several critical layers:
- High-Performance Data Connectors: Direct, secure pipelines that can query hundreds of different systems—including cloud warehouses, transactional databases, CRM platforms, and flat files—without requiring custom integration code.
- Flexible ETL/ELT Processing: The ability to transform raw data either in transit (ETL) or directly within your target cloud data warehouse (ELT) using scalable compute resources.
- The Secure Semantic Layer: A critical virtualization layer that translates complex database schemas into clear business terms (e.g., translating
usr_st_active_01to “Active Customers”). This ensures that whether a user queries data via Tableau, Power BI, or an AI agent, they are all using the exact same calculated metrics. - Real-Time Dashboards and Streaming Pipelines: Support for sub-second query execution and live data streaming, allowing operational teams to monitor active systems without performance degradation.
- Robust APIs and Extensibility: Extensive developer tools that allow teams to programmatically manage dashboards, automate user provisioning, and embed interactive elements directly into external applications.
To understand how these platforms categorize and process information, let’s look at the four primary types of analytics they perform:
| Analytics Type | Question Answered | Technology Used | Business Example |
|---|---|---|---|
| Descriptive | What happened? | Interactive dashboards, SQL queries, historical reporting | Reviewing monthly recurring revenue (MRR) across regions. |
| Diagnostic | Why did it happen? | Drill-down tools, data mining, semantic layers | Finding that an MRR drop was caused by a specific API outage. |
| Predictive | What will happen? | Machine learning models, time-series forecasting | Forecasting inventory needs for the upcoming holiday season. |
| Prescriptive | How can we make it happen? | Scenario simulation, recommendation engines, AI agents | Automatically adjusting bidding strategies to maximize ad ROI. |
Scalability and Cloud Data Integration
Modern enterprise platforms decouple storage and compute, allowing organizations to scale their data operations infinitely without overpaying for idle hardware.
By leveraging serverless cloud data platforms like BigQuery | AI data platform | EDW, companies can run complex analytical queries across petabytes of data in seconds. Furthermore, modern architectures support hybrid-cloud deployment and “zero data movement” architectures (such as querying Apache Iceberg tables directly), allowing you to analyze data exactly where it lives without incurring expensive data extraction and transfer costs.
Key Business Benefits for Large Organizations
Investing in a modern enterprise analytics platform yields immediate, measurable returns across every layer of a large organization.

Here is how enterprise-grade analytics transforms daily operations:
- Improved Operational Efficiency: By connecting data preparation, machine learning, and governance in one platform, organizations can dramatically accelerate their analytics delivery. For example, global manufacturing leaders like Mitsubishi Electric reported a 60% acceleration in analytics delivery after unifying their data prep and ML workflows.
- Enhanced Customer Experience: Unifying touchpoints across web, mobile, support, and sales applications allows product and customer success teams to identify friction points instantly. Teams can easily run behavioral analyses and A/B tests to optimize user journeys and boost conversion rates.
- Accurate Demand Forecasting: Retailers and consumer goods companies can combine past sales data with external market indicators to optimize supply chains, avoiding stockouts and reducing warehouse overhead.
- Proactive Risk Mitigation: Financial services and healthcare providers can continuously monitor transactions and patient records to flag anomalies, detect fraud, and ensure compliance with strict industry regulations.
- Democratized Insights: By giving non-technical staff safe, governed self-service access to data, you free up your data engineering team from building endless custom reports, allowing them to focus on high-value data architecture projects.
Overcoming Implementation Challenges and Ensuring Governance
While the benefits are clear, implementing an enterprise analytics platform at scale is not without its hurdles. Many organizations struggle to move their analytics projects from initial pilots into full-scale production. In fact, 74% of data leaders say their organizations struggle to move AI from experimentation into production at scale.
The most common roadblocks include:
- Data Silos and Legacy Systems: Older, on-premises systems often store data in proprietary formats, making integration difficult and creating blind spots when migrating to modern cloud architectures.
- Data Quality Issues: If your underlying data is messy, inaccurate, or incomplete, even the most advanced AI models will produce flawed recommendations (the classic “garbage in, garbage out” dilemma).
- Low Data Literacy: Simply buying a new software platform won’t make your organization data-driven. You must invest in training programs to ensure business teams feel comfortable exploring data and interpreting insights.
To overcome these challenges, progressive companies are shifting toward embedding analytics directly into the software tools their employees and customers already use every day. Rather than forcing users to log into a separate BI tool, bringing the charts directly to their workflow solves adoption and literacy issues in one go. You can explore how this works in our deep dive into Embedded Data Analytics.
Security, Compliance, and Access Control
As data volume grows, so does the risk of data breaches and regulatory non-compliance. A modern enterprise platform must provide robust, enterprise-grade security controls out of the box.
- Fine-Grained Access Control: Security teams must be able to enforce column-level and row-level security (RLS). This ensures that while a regional sales manager can only see data for their specific territory, a global VP can view the entire organization’s performance within the exact same dashboard.
- Identity and Access Management (IAM): Seamless integration with enterprise identity providers via Single Sign-On (SSO) protocols like SAML 2.0 and OIDC, alongside SCIM provisioning for automated user management.
- Comprehensive Audit Logs: Native tracking of every query run, dashboard accessed, and configuration change made, ensuring complete traceability for compliance audits.
- Regulatory Compliance: Adherence to global frameworks such as GDPR, HIPAA, and ISO 27001. Furthermore, modern platforms must align with emerging AI regulations, such as the EU AI Act and the NIST AI Risk Management Framework, which mandate strict governance and transparency for high-risk AI models.
How to Evaluate and Choose the Right Solution
Choosing the right platform is a major strategic decision that will impact your organization’s agility for years to come. To help guide your search, we recommend using a structured evaluation checklist:
- Infrastructure Flexibility: Does the platform run natively on your cloud of choice (AWS, Azure, Google Cloud), or support hybrid and on-premises deployments if your data residency policies require it?
- AI and Machine Learning Readiness: Can the platform easily integrate with your existing ML pipelines, support natural language queries, and handle agentic AI workflows?
- Ease of Integration: Does it offer robust APIs, SDKs, and pre-built connectors to integrate seamlessly with your existing tech stack?
- Governance and Security: Does it support the exact row-level security, SSO, and compliance certifications your security team requires?
- Total Cost of Ownership (TCO): Beyond the initial licensing fees, what are the long-term costs of data storage, compute, user training, and developer maintenance?
For a comprehensive comparison of the top-performing platforms in the market today, you can review our curated list of the 10 Best Enterprise Analytics Platform of 2026. If you are looking for highly integrated solutions that blend enterprise planning with predictive modeling, platforms like the SAP Analytics Cloud | BI, Planning, and Predictive Analysis Tools or the visual-first capabilities of Business Intelligence and Analytics Software | Tableau are excellent places to start your evaluation.
Frequently Asked Questions about Enterprise Analytics
What is the difference between an enterprise analytics platform and traditional BI?
Traditional BI tools focus primarily on taking structured data and outputting static, backward-looking visualizations. An enterprise analytics platform manages the entire end-to-end data lifecycle—including automated data ingestion, transformation, predictive machine learning, and AI-driven workflow automation—in a single, highly governed environment.
For companies looking to share these insights externally, using a dedicated Embedded Analytics Platform allows you to deliver these advanced analytics capabilities directly inside your own SaaS applications without having to build them from scratch.
How do modern platforms support data governance and security?
Modern platforms enforce centralized governance through a virtual semantic layer, ensuring consistent metric definitions across all dashboards. They protect sensitive data using role-based access control (RBAC), row-level security (RLS), and column-level masking, while integrating directly with enterprise SSO providers (SAML/OIDC) and maintaining detailed audit logs for regulatory compliance.
What is agentic analytics and how does it work?
Agentic analytics is an AI-driven approach where autonomous software agents actively monitor your data pipelines, detect anomalies, conduct root-cause analyses, and trigger automated workflows or recommend business actions without requiring direct human intervention. This shifts analytics from a passive “ask and visualize” model to an active “detect and act” framework.
Conclusion
The modern enterprise landscape is moving incredibly fast. Relying on static, fragmented dashboards to run your business is like trying to drive a car while only looking in the rearview mirror. To keep pace with a world where data volumes are growing by 22% annually, organizations need a unified, secure, and AI-ready enterprise analytics platform to turn raw data into immediate, autonomous action.
However, building and maintaining these complex dashboard architectures across multiple business units is incredibly resource-intensive. Enterprise data is often fragmented across different BI tools—some teams love Tableau, others swear by Power BI, while developers prefer Metabase.
This is exactly why we built Embedportal.
As a white-label embedding platform, we make it simple for teams to embed multi-vendor analytics (Tableau, Power BI, QuickSight, and Metabase) directly into their applications. With Embedportal, you get unified branding, enterprise-grade row-level security, and seamless SSO integration—all deployed in under an hour.
Ready to simplify your analytics deployment and deliver a seamless, branded reporting experience to your users?
Scale your insights with Embedded BI and start your free trial with Embedportal today.