Stop Building From Scratch: Why an Embedded Analytics Solution is Your Best Bet
What Is an Embedded Analytics Solution (and Do You Actually Need One)?
An embedded analytics solution is software that lets you integrate dashboards, reports, and data visualizations directly into your product — so your users never have to leave your app to see their data.
Quick answer:
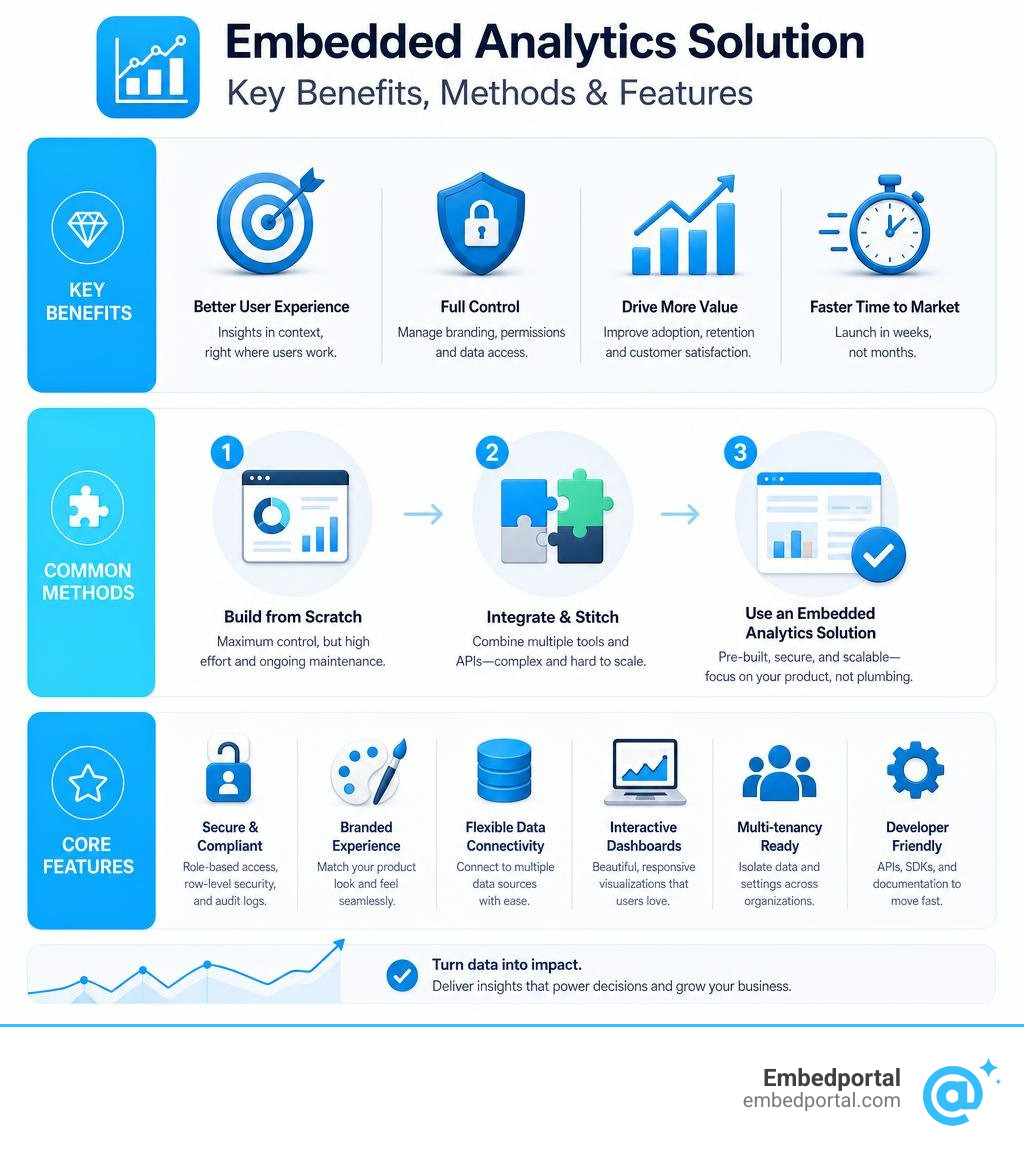
- Embed analytics = BI dashboards live inside your product, not in a separate tool
- Users get insights in context, without switching apps
- You control the branding, permissions, and data access
- Most teams ship in weeks, not months — compared to building from scratch
If you’ve ever tried to wire Tableau, Power BI, or another BI tool into a customer-facing portal, you know how fast it gets complicated. Custom embedding code. Row-level security that breaks when you add a second vendor. Branding that never quite matches. Auth flows you have to rebuild for every tool.
And that’s before you consider ongoing maintenance.
The reality is that most product and analytics teams underestimate what it takes to build this properly. The first dashboard takes a sprint. Getting permissions, multi-tenancy, and consistent branding right across multiple BI tools? That takes months — and it never really stops taking engineering time.
That’s why more SaaS companies are turning to a dedicated embedded analytics solution instead of building from scratch. According to recent research, 55% of product teams already offer embedded analytics in their products, and 57% say it had a direct impact on revenue.
This guide covers everything you need to know to make the right call for your team.
Traditional BI vs. Embedded Analytics: What’s the Difference?
To understand why a dedicated embedded analytics solution is so transformative, we have to look at how traditional business intelligence (BI) operates.
Traditional BI was designed for internal analyst teams. It requires users to log into a standalone BI portal, navigate complex folders, and interpret raw data. When software companies try to use traditional BI for external customers, they usually build basic authentication wrappers around dashboards. The result? A disjointed user experience that forces customers to toggle between their core workflow and a separate reporting tab.
Embedding bridges this gap by bringing those robust analytical capabilities directly into your existing software.
With Embedded Analytics, data analysis is integrated directly into the user’s daily workflow. Instead of switching tools, a sales rep can view pipeline forecasts right inside their CRM, or a logistics manager can view delivery optimization metrics directly on their dispatch screen. It removes the friction of context switching, converting static charts into interactive, actionable experiences.
The Core Benefits of Embedded Analytics for SaaS and Enterprise Applications
Implementing modern Embedded Data Analytics isn’t just a technical upgrade; it is a major business driver. Product leaders in 2026 are increasingly viewing analytics as a core product offering rather than a post-launch add-on.
1. Increased Product Adoption and User Engagement
When insights live where decisions are made, users engage. According to industry surveys, 61% of product leaders reported that embedded analytics resulted in increased user engagement. By providing immediate, contextual data, you make your application indispensable. For example, after integrating advanced analytics, healthcare audit platform MDaudit saw a 50% increase in user growth within a single year.
2. New Monetization and Revenue Streams
Analytics is one of the easiest features to monetize. 57% of product leaders state that embedded analytics directly increased their revenue, and 44% expect ongoing revenue gains from their analytical offerings. You can package your data in three main ways:
- Core Value (Retention): Bundling basic dashboards into your standard tier to increase platform stickiness.
- Premium Upsell (Monetization): Offering advanced self-service report builders, custom dashboards, and AI-powered insights as a premium add-on tier.
- Data-as-a-Service (Wrapping): Providing raw data feeds or white-labeled portals to enterprise clients who require custom reporting.
3. Reduced Engineering Bottlenecks
Building reporting tools from scratch drains engineering resources. By using a pre-built Embedded Analytics Platform, your developers don’t have to spend sprints building chart libraries, managing SQL queries, or troubleshooting visualization bugs. They can focus entirely on your core product features.
Common Use Cases and Industries
Every industry has unique data needs, but the desire for seamless, in-context insights is universal.
- SaaS & Product Management: Platforms embed usage dashboards to show customers the exact ROI they are getting from the software.
- Fintech & Financial Services: Payment gateways and investment platforms embed real-time transaction trends, fraud detection alerts, and portfolio performance charts.
- Healthcare & Clinical Operations: Hospital management systems embed patient flow metrics, outcome tracking, and resource allocation dashboards directly into clinical portals.
- Logistics & Supply Chain: Dispatch software embeds live route tracking, fuel efficiency metrics, and warehouse inventory trends.
Methods of Embedding Analytics: Tight vs. Loose vs. No Integration
When implementing an embedded analytics solution, you must choose how deeply to integrate the BI components into your application.

1. Tight Integration (SDKs and Web Components)
This method utilizes developer-friendly APIs, SDKs, or native Web Components to embed dashboards directly into your application’s frontend framework.
- When to use: When you need a highly tailored user experience, deep interactive capabilities (like two-way communication between the host app and the charts), and native page performance.
- Pros: Seamless UX, matches your CSS perfectly, and bypasses third-party cookie restrictions.
- Cons: Requires more frontend engineering resources to set up initially.
2. Loose Integration (Secure iFrames)
This is the most common and fastest way to embed. You generate a secure, token-authenticated iFrame URL from your BI tool and drop it into your application page.
- When to use: When you need to get to market in days rather than months and want to minimize engineering overhead.
- Pros: Extremely fast implementation; as the saying goes, The Iframe is the Easy Part: What Embedded Analytics Needs is simply a secure container.
- Cons: Limited ability to customize internal styling or trigger host-app actions based on dashboard clicks.
3. No Integration (Redirection/External Portals)
Users click a link in your application and are redirected to a co-branded external portal or a separate tab to view their reports.
- When to use: For legacy enterprise systems or basic public data sharing where user experience is not a competitive differentiator.
- Pros: Zero development work on your main application.
- Cons: Poor user experience, breaks the application flow, and hurts engagement.
Key Features to Look For in an Embedded Analytics Platform
Not all platforms are created equal. When researching the Best Embedded Analytics Tools, ensure your chosen solution checks these boxes:
- Multi-Vendor Support: Many platforms lock you into a single BI tool. If your marketing team uses Tableau but your product team prefers Power BI or Metabase, look for an orchestrator like Embedportal that lets you securely embed dashboards from any vendor under a single unified portal.
- True White-Labeling: Your customers should never know you are using a third-party BI engine. Look for deep White Label Analytics features that allow you to customize fonts, colors, logos, and domains to match your brand perfectly.
- Self-Service Capabilities: Advanced users will want to edit dashboards or build their own reports. Your platform should support governed self-service without exposing raw database tables.
- High Performance and Scalability: The platform must handle complex queries and scale to thousands of concurrent users without slowing down your core application.
How AI Enhances Embedded Analytics Capabilities
Artificial Intelligence is shifting embedded analytics from static, retroactive dashboards to proactive, conversational experiences.
Modern AI integrations allow non-technical users to perform Natural Language Queries (NLQ). Instead of filtering a complex chart, a user can simply type, “Show me our top-performing region last quarter,” and receive an instant visualization. AI also automates anomaly detection—flagging transaction spikes or drop-offs in real time—and generates automated KPI summaries to explain the “why” behind data changes.
However, implementing AI in customer-facing portals introduces security risks. It is critical that your AI layer respects the same row-level security and tenant boundaries as your standard dashboards. The AI must never access or summarize data belonging to another customer tenant.
Build vs. Buy: The Ultimate Decision Framework
Every product team asks: “Should we just build these dashboards ourselves using custom chart libraries?”
It is easy to underestimate the “build” path. A single dashboard using an open-source library might take a couple of weeks. But building enterprise-grade analytics means building:
- User permissions and multi-tenant data isolation
- SSO and authentication bridges
- An interactive dashboard builder for non-technical users
- Export engines (PDF, CSV, scheduled emails)
- Caching and query performance optimization layers
Maintaining this infrastructure can easily cost upwards of $300,000 per year in engineering salaries alone. By purchasing a dedicated embedded analytics platform, you can redirect your engineering resources back to your core product, launching robust, secure analytics in weeks instead of quarters.
Security, Governance, and Multi-Tenant Requirements
When presenting data to external customers, security is non-negotiable. A leak of tenant data can ruin a SaaS business overnight.
- Row-Level Security (RLS): Your platform must dynamically filter data so that users only see records associated with their specific tenant ID.
- Single Sign-On (SSO): Your users should never have to log in twice. The embedded analytics platform must seamlessly integrate with your existing authentication provider (JWT, SAML, OAuth) to pass user identities securely.
- Tenant Isolation: Multi-tenant SaaS applications require logical or physical isolation at the query execution layer to guarantee that data queries never cross tenant boundaries.
- Enterprise Compliance: Ensure the underlying infrastructure meets top-tier security standards, including SOC 2 Type II, GDPR, and HIPAA compliance.
How to Evaluate and Choose an Embedded Analytics Partner
When searching for the right partner, don’t just look at their visualization features. You need a platform that aligns with your engineering workflow and business model.
- Multi-BI Capability: Can they handle dashboards built in different BI tools, or do they lock you into their proprietary visualization engine?
- Developer Experience: Do they provide comprehensive APIs, clean documentation, and modern SDKs?
- Deployment Flexibility: Can you deploy the platform in your own cloud, or are you forced to use their hosted environment?
- Speed to Market: How quickly can you go live? Look for platforms that let you deploy secure, white-labeled dashboards in under an hour.
You can Compare different approaches to see how modern orchestration platforms streamline this process.
Pricing Models and Costs: What to Expect in 2026
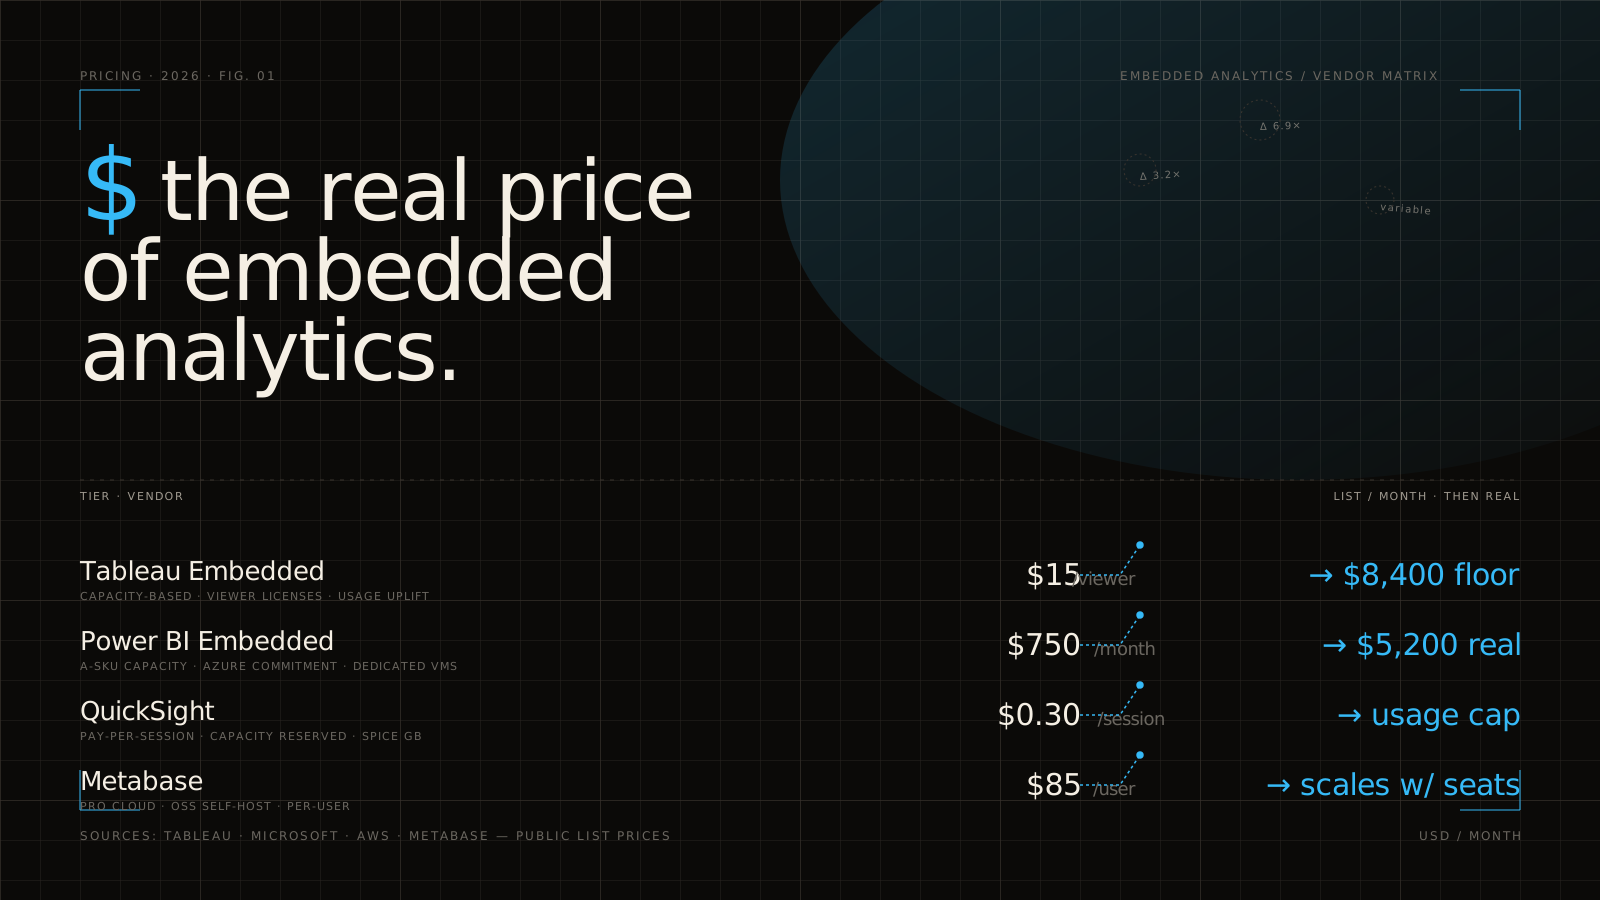
Embedded analytics pricing has historically been complex and unpredictable. Traditional BI vendors often charge per-user fees, which quickly penalizes your growth as your SaaS application scales.
To understand how to budget, review How Embedded Analytics Pricing Actually Works in 2026. The industry generally uses three pricing structures:
- User-Based Pricing: You pay for every viewer or creator. This is highly expensive for customer-facing SaaS.
- Capacity/SKU-Based Pricing: You pay for dedicated cloud resources (which often start around $1,000/month depending on the BI vendor). This can be cost-effective for high volumes but requires careful resource management.
- Predictable Flat-Rate Pricing: A modern approach where you pay a flat monthly fee for unlimited users and usage, allowing you to scale your application without unpredictable cost spikes. Learn more about budgeting for these platforms in our guide to Embedded Analytics Pricing.
Transitioning from Code-Heavy Setups to a Unified Portal
If you are currently managing custom iframe code, complex JWT token generators, and fragmented CSS files for multiple BI tools, there is a better way.
At Embedportal, we built a white-label embedding platform specifically to solve these headaches. Located in California, USA, we help SaaS and enterprise product teams integrate dashboards from Tableau, Power BI, QuickSight, and Metabase into their applications in under an hour.
Instead of writing custom code for every BI tool, our platform provides unified branding, robust row-level security, and out-of-the-box SSO integration. We handle the complex infrastructure layer so your developers can focus on what they do best: building your core product.
Ready to stop building analytics from scratch? Explore our Embedded Analytics for SaaS solutions to see how modern organizations are scaling their data experiences.
To see how we can streamline your embedding workflow, explore our comprehensive Embedded BI Solutions and start delivering world-class analytics to your customers today.