
How to Build a Secure Multi Tenant Dashboard for Your SaaS
Why Multi-Tenant Analytics Is the Backbone of Every Scalable SaaS Product
Multi-tenant analytics is a system where a single analytics platform serves multiple customers simultaneously — using shared infrastructure, but keeping each customer’s data completely isolated from everyone else’s.
Here’s a quick breakdown of what that means in practice:
| Concept | What It Means |
|---|---|
| Multi-tenancy | One platform, many customers, shared infrastructure |
| Data isolation | Each customer sees only their own data |
| Shared dashboards | One dashboard template serves all tenants |
| Access control | Row-level security and tokens enforce boundaries |
| Compliance | Architecture choice drives HIPAA, GDPR, PCI DSS alignment |
If you’re building a SaaS product that embeds analytics for customers, this is the architecture problem you will hit — usually sooner than expected.
More than 50% of enterprises had already embedded analytics directly into their operational platforms as of 2024. And over 82% of new analytics deployments that year were cloud-based. Analytics is no longer a “nice to have” bolt-on. It’s a core part of the product.
But here’s where most teams get caught off guard: replicating your application’s tenancy model inside your analytics layer is significantly harder than it looks.
Your app already knows which customer is logged in. Your database already separates their data. But your analytics tools — dashboards, BI embeds, reporting engines — often have no idea. That gap creates real risk. A misconfigured filter or missing row-level security policy can expose one customer’s data to another. And with the U.S. average cost of a data breach hitting $10.22 million in 2025, getting this wrong is not a recoverable mistake.
This guide walks through how to build a secure multi-tenant analytics architecture for your SaaS — from choosing the right data model to enforcing access controls to deciding whether to build it yourself or use a purpose-built platform.
What is Multi Tenant Analytics and Why Does Your SaaS Need It?
At its core, multi tenant analytics is about delivering personalized, highly secure, and interactive data dashboards to thousands of different customer organizations (tenants) without rebuilding those dashboards for every single user. Whether your customers are retail store owners tracking daily inventory or healthcare clinics monitoring patient outcomes, they expect modern, real-time insights embedded directly into their daily workflows.
Traditional BI tools were designed for internal business analysts looking at company-wide data. They assume that everyone accessing the dashboard works for the same organization. When you try to bring those tools into a SaaS environment, they break down. They do not natively understand that Tenant A must never, under any circumstance, catch a glimpse of Tenant B’s data.
To bridge this gap, SaaS platforms must implement native Multi-Tenant Analytics structures. This means decoupling the analytical layer from the raw storage layer, using a semantic bridge that maps your application’s user permissions directly to your underlying data queries. By doing so, you can deliver deep analytical value to your customers while maintaining absolute, ironclad data isolation.
Core Benefits of Multi-Tenant Analytics for Modern SaaS
When you build a robust multi-tenant system, the benefits extend far beyond simply checking a feature box. It fundamentally changes your unit economics and customer satisfaction:
- Unmatched Cost Efficiency: Instead of spinning up a dedicated virtual machine, database instance, and visualization server for every customer, you share a single, centrally managed infrastructure. This significantly lowers your cloud hosting costs and keeps your margins healthy.
- Scalability that Grows with You: Onboarding a new customer shouldn’t require your engineering team to run custom database scripts or manually copy dashboard files. A true multi-tenant setup allows you to onboard thousands of tenants programmatically.
- Increased User Retention and Monetization: Providing in-app dashboards keeps users engaged inside your software longer. It also opens up new revenue streams, allowing you to offer advanced reporting or self-service visualization as a premium, tiered upgrade.
By integrating Embedded Analytics for SaaS directly into your core product, you transform raw data from an operational byproduct into a primary value driver.
The Challenge of Replicating Application Tenancy in Analytics
If multi-tenant reporting is so beneficial, why doesn’t every SaaS startup ship it on day one? Because replicating your core application’s tenancy in an analytical environment is incredibly complex.
Your transactional database is built for fast, single-row writes. Your analytical database, however, is designed for massive, multi-column aggregations. When you move data from your transactional system to your analytical data warehouse, you have to map the schema perfectly while preserving the exact user contexts and tenant boundaries defined in your application logic.
If a user’s role changes from “Viewer” to “Admin” in your app, that change must propagate to your Embedded Analytics dashboards in real time. Manually managing these permissions, database connections, and schema updates across hundreds of isolated customer databases quickly becomes an engineering nightmare.
Architectural Data Models for Multi-Tenant Dashboards
The foundation of your multi-tenant analytics strategy is your data model. How you store and organize your tenants’ data determines your system’s performance, security, and total cost of ownership.
When designing this layer, you must choose between three primary architectural patterns. Each comes with distinct trade-offs in terms of isolation, query speed, and maintenance complexity. For a deeper dive into these structures, you can read about Comparing Different Multitenant Solutions in Real-Time Intelligence – Microsoft Fabric | Microsoft Learn.
| Data Model | Tenant Isolation | Infrastructure Cost | Customization Level |
|---|---|---|---|
| Shared DB / Shared Schema | Logical (Row-Level Security) | Very Low | Low (Strictly uniform schemas) |
| Shared DB / Multiple Schemas | Logical & Schema-Level | Moderate | Moderate (Per-tenant tables) |
| Multiple DBs / Shared Schema | Physical (Database-per-tenant) | High | High (Highly custom routing) |
Shared Database and Shared Schema (Commingled Data)
In a commingled data model, all your tenants share the same database tables. To differentiate between customers, every single row of data includes a tenant identifier column (such as tenantid or customerid).
This model is the absolute champion of cost efficiency. You only run and pay for a single database cluster, and scaling up simply means adding more storage or computing power to that single resource.
However, the security burden is entirely on your query layer. Every time a user requests a dashboard, your application must rewrite the query to append a strict WHERE tenantid = ‘currenttenant’ clause. If an engineer forgets this clause even once, you risk a catastrophic cross-tenant data leak. Additionally, high activity from a single massive customer can trigger the “noisy-neighbor” effect, slowing down query speeds for everyone else on the shared database.
To make this model work at scale, you must apply rigorous database indexing. Making tenant_id your sorted or clustered index ensures that rows for a single tenant are stored physically adjacent to one another. This allows the database engine to perform near-instant segment pruning, skipping unrelated data pages entirely during a query.
Shared Database with Multiple Schemas
This model offers a middle ground. All tenants live in the same physical database instance, but each tenant is assigned their own isolated schema (a logical namespace containing their specific tables).
This approach provides logical separation. It prevents accidental cross-tenant data leaks because a query run against Tenant A’s schema physically cannot access Tenant B’s tables without an explicit cross-schema join. It also allows you to run tenant-specific schema updates or add custom fields for specific high-value enterprise customers without affecting the rest of your client base.
The trade-off is operational complexity. Running schema migrations becomes a coordinated dance. If you have 500 tenants, you have 500 separate schemas to update, monitor, and back up.
Multiple Databases with Shared Schemas (Database-per-Tenant)
For enterprise SaaS applications serving highly regulated industries like healthcare or banking, physical data isolation is often a hard requirement. In this database-per-tenant architecture, every customer is provisioned with their own physically isolated database instance.
This model provides the highest level of security and customization. There is zero risk of commingled data leaks, and you can easily scale individual databases up or down based on each tenant’s specific workload. If a customer decides to leave your platform, deleting their data is as simple as dropping their dedicated database, which takes only a few seconds.
The primary challenge here is running cross-tenant analytics for your own internal product teams, which requires extracting and reorganizing data into a central data warehouse. You can learn more about managing this pattern in the guide on how to Run analytics queries – Azure SQL Database | Microsoft Learn.
Securing Tenant Data at Scale
No matter which data model you select, security is the ultimate make-or-break factor for your multi-tenant dashboard. With more than 53% of all data breaches involving customer personally identifiable information (PII), your customers need to know that their data is locked down tight.

To guarantee absolute data privacy, you must combine robust database security with modern, token-based application authentication. Setting up Multi-Tenant Row Level Security ensures that tenant isolation is enforced at the database layer, rather than relying solely on your frontend code.
Implementing Row-Level Security (RLS) for Multi-Tenant Analytics
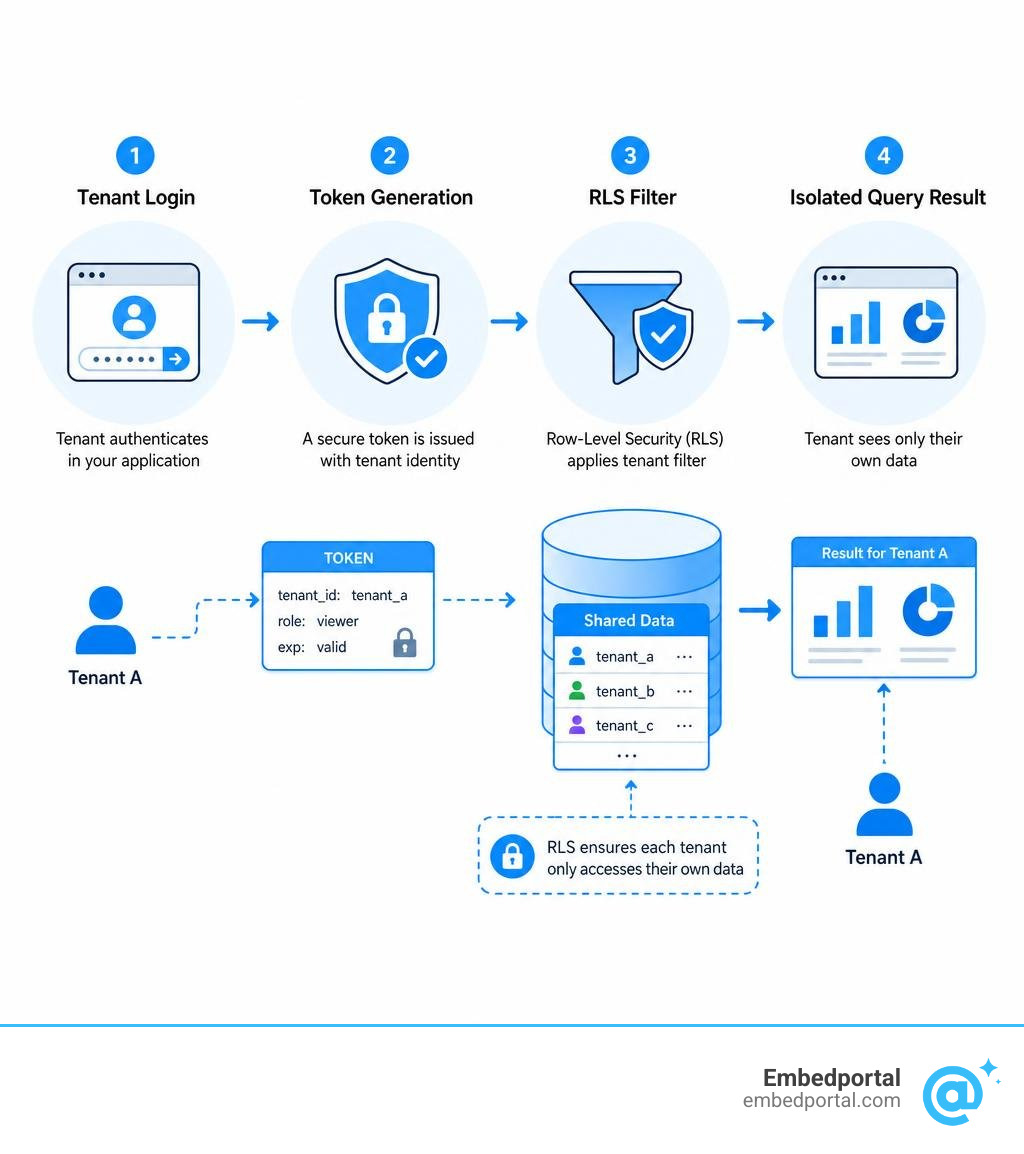
Row-Level Security (RLS) is a database-level feature that automatically restricts which rows a user can query based on their security clearance or tenant ID. Instead of relying on your software developers to manually append tenant filters to every SQL query, RLS builds this logic directly into the database engine itself.
When a user executes a query, the database checks their active session context or security token, identifies their tenant ID, and silently rewrites the query to filter out all other tenants’ data. This creates a fail-safe security boundary. Even if a malicious user attempts to manipulate the frontend dashboard parameters to request another company’s ID, the database engine will block the request and return an empty dataset.
Implementing Row Level Security is highly recommended for shared-schema architectures because it eliminates the human error factor from your query-writing process.
JWT-Based Access Control and Token-Based Embedding
To connect your application’s authentication system to your embedded dashboards, you should use JSON Web Tokens (JWTs). When a user logs into your SaaS platform, your backend server generates a signed JWT that contains the user’s identity, their tenant ID, and their specific permission scopes.
This JWT is encrypted and signed using a secure, server-side private key. Because the token is signed, it cannot be tampered with or modified by the user on the client side. When your frontend requests an embedded dashboard, it passes this JWT along. The analytics layer decrypts the token, verifies the signature, and uses the embedded tenant ID to apply the correct data filters.
By utilizing Centralized Row Level Security driven by JWTs, you ensure that your analytics layer perfectly inherits your core application’s security policies without requiring a separate user management database.
Overcoming Infrastructure and Performance Challenges
As your SaaS platform grows from ten customers to ten thousand, your multi-tenant analytics infrastructure will face intense pressure. User-facing analytics requires low-latency query responses (ideally under a second) and must handle high-concurrency access during peak business hours.
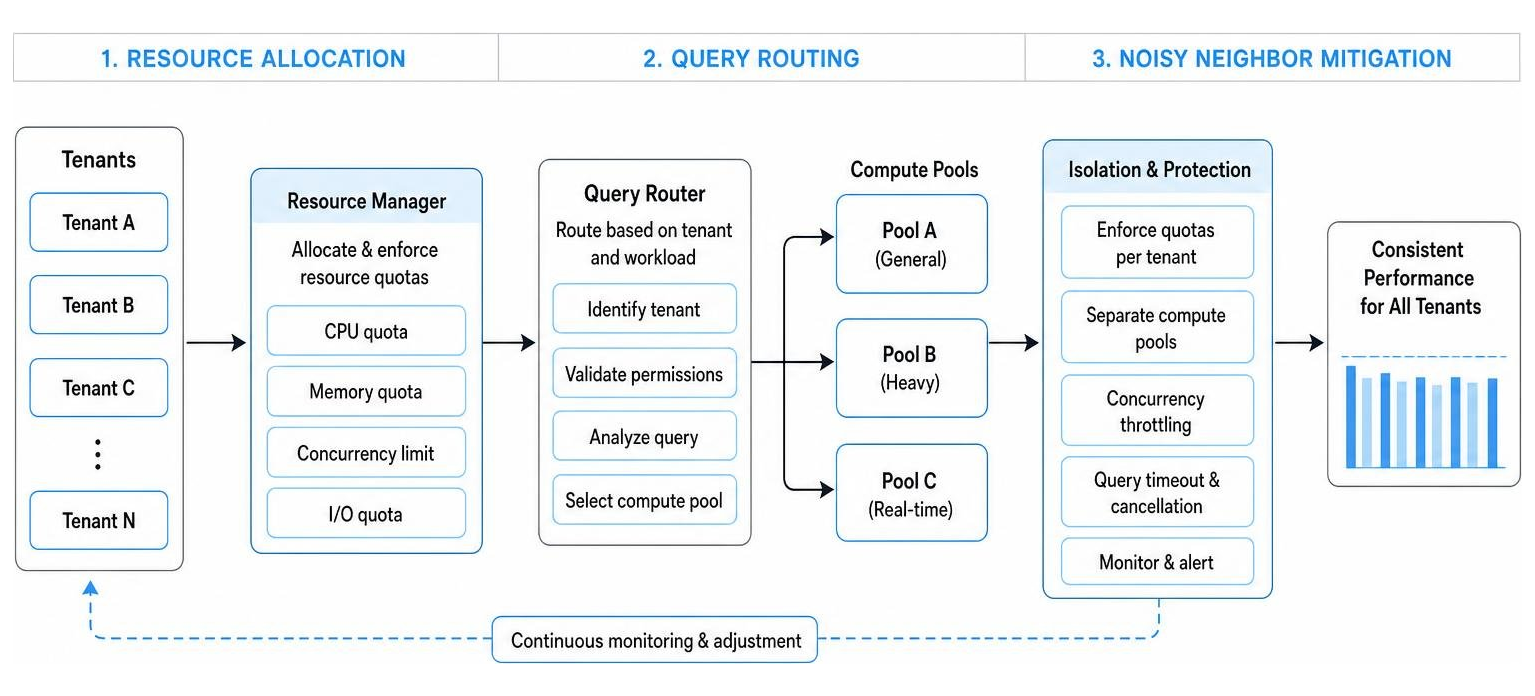
If not managed correctly, the combined stress of multiple active tenants can degrade system workloads by up to 67%. To keep your platform fast and responsive, you must proactively design for resource isolation and dashboard efficiency.
Mitigating the Noisy-Neighbor Effect in Shared Architectures
The “noisy-neighbor” effect occurs when a single, high-volume tenant runs massive, resource-heavy analytical queries, consuming all available CPU and memory on your shared database and slowing down the experience for all other tenants.
To prevent this performance degradation, you should implement the following strategies:
- Workload Groups and Query Quotas: Group your tenants by size or pricing tier. You can allocate dedicated CPU and memory limits to different workload classes, ensuring that your smaller tiers can never starve your enterprise customers of resources.
- Rate Limiting and Query Throttling: Apply strict query rate limits at your API gateway or broker level. If a tenant attempts to spam your server with rapid dashboard refreshes, temporarily throttle their requests to protect overall system health.
- Smart Caching and Pre-Aggregations: Cache common dashboard queries and pre-aggregate high-volume historical data. This reduces the need to query your raw production tables repeatedly, cutting down on compute costs and latency.
For detailed strategies on handling high-concurrency workloads in real-time environments, review the Apache Pinot Multi-Tenant Playbook.
Eliminating Dashboard Duplication with Dynamic Templates
A common, painful mistake that many early-stage SaaS teams make is duplicating their dashboards. When a new customer signs up, they copy their master dashboard file, rename it, and hard-code the new customer’s database connection.
This approach does not scale. If you have 500 customers and want to change a single chart’s color or add a new metric, you have to manually edit 500 individual dashboards.
Instead, you should build dynamic, parameterized dashboard templates. Under this model, you design a single master dashboard. When a user logs in, your system uses runtime parameterization to inject their specific tenant ID or database connection string on the fly.
This approach completely eliminates the need for duplicated instances. It ensures that updates pushed to your master template are instantly inherited by all tenants, reducing your maintenance overhead to near zero. Implementing a standardized schema across all tenant data sources is a critical prerequisite for this to work smoothly. To explore how to build these dynamic, reusable templates, see our guide on SaaS BI Embedding.
Compliance, Business Strategy, and Build vs. Buy Decisions
Choosing how to architect and deliver your multi-tenant dashboards is not just a technical decision; it is a core business strategy. Your choice of data model and infrastructure will directly impact your ability to comply with global data laws, affect your engineering team’s roadmap, and shape how you monetize your product.
How Compliance Requirements Dictate Your Tenancy Model
Global regulatory frameworks have strict, non-negotiable rules regarding how customer data must be handled:
- HIPAA (Healthcare): Often mandates strict logical or physical schema-level separation to protect patient health information.
- PCI DSS (Financial Services): Demands highly secure, often physically isolated database instances per tenant to protect credit card and transaction details.
- GDPR (Europe): Requires robust data residency controls (ensuring European citizens’ data is stored physically within the EU) and the absolute “Right to be Forgotten,” meaning you must be able to completely delete a tenant’s data without affecting others.
If you serve clients in these industries, a simple shared-database model with basic row filtering might not pass a compliance audit. You will likely need to adopt a database-per-tenant model to satisfy their security teams.
The Engineering Tax: Building In-House vs. Buying a Platform
When deciding whether to build your multi-tenant analytics layer from scratch or buy a purpose-built embedding platform, you must calculate the true “engineering tax” of a custom build.
Many teams assume that building a few charts using open-source libraries is easy. However, software engineers are not data engineers. The national average salary for a data engineer is approximately $134,656, which is significantly higher than a general software engineer’s salary of $114,168.
If your core developers are spending hundreds of hours managing database connection pools, configuring SSO tokens, building custom PDF exporters, and patching security vulnerabilities, they are not building the core features that differentiate your product in the market.
By choosing to buy a purpose-built White Label Analytics platform, you can bypass months of infrastructure development, reduce your time-to-market, and let your engineering team focus on what they do best.
Frequently Asked Questions about Multi-Tenant Analytics
Navigating the complexities of multi-tenant data architecture can raise many technical questions. Here are some of the most common queries we hear from product teams.
How do you prevent the noisy-neighbor effect in shared-schema databases?
Preventing the noisy-neighbor effect requires a multi-layered approach. First, ensure that your database tables are properly indexed, ideally using your tenant ID as a clustered or sorted index key. This minimizes the amount of data the engine has to scan for any single query. Second, implement workload groups or query queues to limit the maximum CPU and memory a single tenant can consume. Finally, use aggressive query caching and pre-aggregation tables so that heavy dashboards don’t hit your live production database on every single page load.
Can we use a single dashboard template for multiple databases?
Yes, absolutely. By using runtime parameterization, you can route a single dashboard template to different databases depending on who is logged in. When a user authenticates, your application generates a secure token containing their specific database connection parameters (such as host, database name, and port). The analytics engine reads these parameters at query execution time and dynamically establishes a connection to that specific tenant’s database. This keeps your dashboard maintenance completely centralized while keeping your data physically isolated.
How does row-level security differ from database-level isolation?
Row-level security (RLS) is a logical isolation method. All tenants’ data resides in the same database and tables, and the database engine filters the rows automatically based on the user’s security context. Database-level isolation is a physical isolation method where each tenant has their own completely separate database instance. RLS is highly cost-effective and easy to scale, but carries a slightly higher risk of configuration error. Database-level isolation is more expensive and complex to manage, but offers the absolute highest level of security, performance isolation, and compliance alignment.
Conclusion
Building a secure, performant, and scalable multi-tenant analytics system is one of the most critical product decisions your SaaS team will make. While the underlying database design and security models require careful planning, delivering the actual user-facing dashboards doesn’t have to take months of custom engineering.
At Embedportal, we provide a powerful, white-label embedding platform designed specifically to solve these multi-tenant challenges. Based in California, USA, our platform allows your team to embed dashboards from your favorite BI vendors — including Tableau, Power BI, QuickSight, and Metabase — with unified branding, centralized row-level security, and seamless SSO integration in under an hour.
Instead of paying the “engineering tax” of building and maintaining custom reporting infrastructure, you can rely on us to deliver a fast, secure, and beautiful analytical experience to your customers. Ready to see how easy it is to scale your SaaS reporting? Secure your SaaS dashboards with Embedportal and start delivering world-class insights to your tenants today.