
Stop Building From Scratch: Why You Need an Embedded BI Dashboard
Why Every SaaS Product Needs an Embedded BI Dashboard
An embedded BI dashboard puts analytics directly inside your product – no tab-switching, no separate login, no context lost.
Here’s a quick look at what that means in practice:
| Question | Quick Answer |
|---|---|
| What is it? | Analytics built into your app, not bolted on as a separate tool |
| Who uses it? | SaaS products, internal tools, customer-facing portals |
| Main embedding methods | iFrame, SDK, API, Web Components |
| Key security features | Row-level security, JWT auth, SSO, multi-tenancy |
| Typical cost range | From roughly $9,600/yr for entry-level embedded analytics to $180,000+/yr for enterprise deployments |
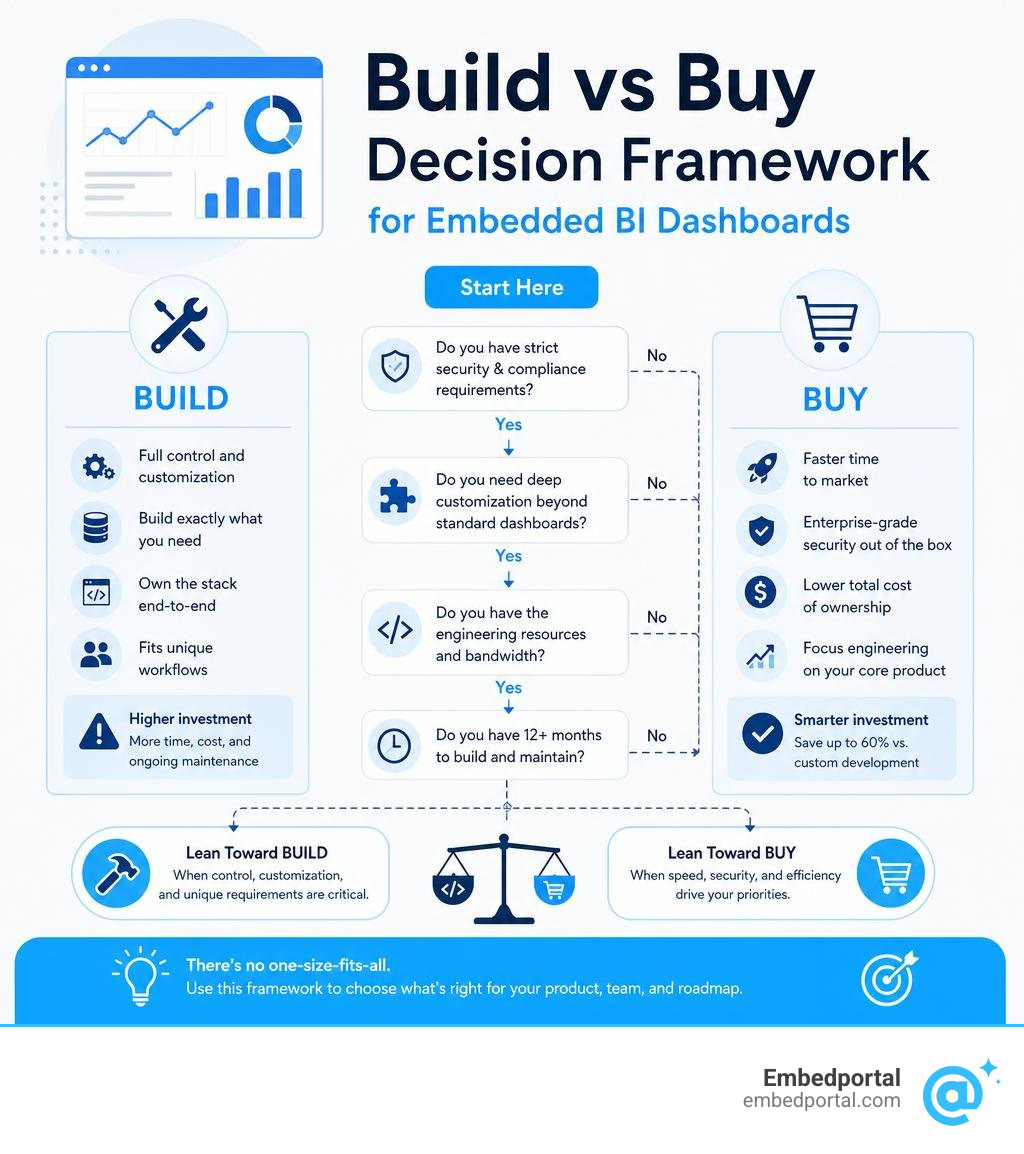
| Build vs. buy | Buying saves up to 60% vs. custom development |
Imagine your users switching between five different tools just to answer one simple question about their own data. Every switch costs attention. Every extra login loses trust. And every “we’ll add that to the roadmap” email costs you a renewal.
That’s the problem embedded BI solves.
The embedded analytics market is growing fast – from $18.3 billion in 2023 to a projected $52.7 billion by 2030. And it’s not hard to see why. Organizations that embed analytics report a 30% increase in user engagement and a 25% reduction in churn.
But for analytics and product leads at SaaS companies, the reality is messier. You’re often juggling:
- Dashboards from multiple BI sources that need to live inside one branded portal
- Row-level security that has to work consistently across all of them
- Branding and auth that needs to feel native, not like a patchwork of iFrames
Building all of that from scratch is slow, expensive, and pulls engineering focus away from your core product.
This guide breaks down how to evaluate embedded BI tools – and when buying beats building every time.
What is an Embedded BI Dashboard and How Does It Differ from Traditional BI?
To understand why an embedded BI dashboard is so powerful, we have to look at what came before it.
Traditional business intelligence tools are built for internal data teams. They live on their own standalone platforms. If an executive or a marketing manager wants to check performance metrics, they must leave their active workspace, log into a separate BI tool, navigate a complex folder structure, and find the right report. This constant context switching is a major friction point. In fact, it is the primary reason why traditional BI tools often suffer from low user adoption.
Embedded business intelligence, on the other hand, integrates reporting and data visualization directly into the software applications your teams and customers already use. Whether it is an internal CRM, an ERP, or a customer-facing SaaS platform, the analytics are baked right into the interface.
By removing the friction of context switching, an Embedded BI solution completely changes how users interact with data. Instead of exporting CSV files and filing IT tickets for custom reports, users can filter, drill down, and explore data in real time. This accessibility improves decision-making speed by an average of 20%. As detailed in Embedded Analytics 101: Facilitating data-driven decisions across the … , bringing data directly to where work happens facilitates faster, more reliable, data-driven decisions across your entire organization.
Technical Architecture: Embedding Methods and Security
When integrating an embedded BI dashboard into your application, your engineering team must choose the right embedding method. The four most common approaches are:
- iFrames (Inline Frames): The simplest and fastest way to embed. You generate a secure URL from your BI tool and drop it into an
tag in your application. While it requires almost no code, it offers very limited customization, poor responsiveness on mobile devices, and weak programmatic interaction between the host app and the dashboard. - Software Development Kits (SDKs): A developer-friendly approach where you use a JavaScript SDK to render and interact with dashboards. This allows your application to listen to events inside the dashboard (like a user clicking a data point) and trigger actions in your host application, or vice versa.
- APIs (Application Programming Interfaces): This method involves querying the BI platform’s backend directly for raw data or pre-rendered visualization components. It offers maximum flexibility but requires significant development work to build the frontend components yourself.
- Web Components: A modern, browser-native approach. By utilizing custom HTML elements (such as
), developers can embed complex, interactive dashboards with simple tags while maintaining high performance and clean code separation.

Selecting the right method depends on your development timeline, engineering resources, and the complexity of your Embedded Analytics Platform.
Implementing Multi-Tenancy and Row-Level Security in Your Embedded BI Dashboard
If you are building a SaaS application, security is your top priority. You cannot let Customer A accidentally see Customer B’s data. This requires a robust architecture for multi-tenancy and Row-Level Security (RLS).
Multi-tenancy ensures that your database or data warehouse isolates tenant data securely. When a user logs in, your host application must pass their identity and access permissions to the embedded dashboard.
This is typically achieved using JSON Web Tokens (JWT) and Single Sign-On (SSO). When your application requests an embedded dashboard, your backend signs a short-lived JWT containing the user’s tenant ID and role-based permissions. The embedded BI engine verifies this token and dynamically injects these claims as SQL predicates. This ensures that the underlying database queries are filtered automatically, keeping data completely isolated at the database level. For a deeper look at how to set this up for software applications, check out our guide on Embedded Analytics for SaaS.
Customizing the Look and Feel of Your Embedded BI Dashboard
For a truly native user experience, your embedded dashboards must not look like a third-party add-on. They need to match your application’s design system perfectly.
High-quality embedded BI tools offer extensive White Label Analytics capabilities. This goes far beyond just replacing the vendor’s logo with your own. It includes:
- Custom CSS and Themes: Overriding default styles to match your application’s exact color palette, typography, and button styles.
- Custom Layouts: Designing responsive grid structures that adapt seamlessly to different screen sizes, including mobile devices.
- Custom Visualizations: Building unique chart types that are tailored specifically to your industry’s data requirements.
When done correctly, your users won’t even realize they are looking at an embedded BI tool—it will feel like a seamless, custom-built feature of your core product.
Evaluating Pricing Models and Total Cost of Ownership
One of the biggest hurdles in adopting an embedded BI dashboard is navigating the complex pricing models of various vendors. Unlike traditional BI, where you simply buy a license for every internal user, embedded BI pricing must scale with your application’s growth without breaking the bank.
Here is a breakdown of the three most common pricing models:
- Seat-Based Pricing: You pay a fixed fee per viewer or designer. While simple, this model can quickly become cost-prohibitive as your SaaS platform scales to thousands of active users.
- Usage-Based Pricing: You pay based on query volume, data processing, or computational hours. This is highly cost-effective for low-volume applications but can lead to unpredictable monthly bills as usage spikes.
- Platform/Flat-Rate Pricing: You pay a predictable, flat annual or monthly fee for unlimited viewers. This is the ideal model for growing SaaS platforms, as it allows you to scale your user base without worrying about escalating licensing costs.
To help you compare the market, we have compiled typical cost ranges and pricing metrics for common embedded BI approaches based on industry data:
| Embedded BI Approach | Pricing Metric | Estimated Annual Cost | Best Suited For |
|---|---|---|---|
| Entry-level embedded analytics | Seat-based / Viewer-tiered | ~$6,000/yr and up | Small to mid-sized applications |
| Mid-market semantic-layer platforms | Flat platform tiers | $9,600+/yr | Mid-market teams needing governed metrics and reusable data models |
| Cloud capacity embedding | Capacity-based nodes | Starts at ~$8,830/yr | Enterprise teams standardizing on cloud infrastructure |
| Warehouse-native analytics platforms | Platform + user fees | ~$57,000/yr average | Cloud data warehouse-heavy teams |
| Enterprise analytics suites | Usage & platform fees | ~$134,000/yr average | Large enterprises needing end-to-end pipelines |
| Enterprise semantic BI embedding | Platform + user fees | Starts at $180,000+/yr for embedded deployments | Large enterprises with complex semantic needs |
When calculating the total cost of ownership, remember to look beyond the vendor’s licensing fee. Factor in the engineering hours required for initial integration, ongoing maintenance, database query costs, and the cost of upgrading your hosting infrastructure to handle high query volumes. For a comprehensive breakdown of these hidden fees, read our full article on Embedded Analytics Pricing.
Frequently Asked Questions about Embedded Analytics
What is the difference between iframe and SDK embedding?
Iframe embedding is a low-code approach where you place an external web page inside your application. It is incredibly quick to set up but acts as an isolated window, making it difficult to pass data back and forth between your app and the dashboard.
SDK embedding, such as the methods discussed in this embedded analytics developer overview, offers deep programmatic integration. An SDK allows your developers to control dashboard states, trigger native browser actions from chart clicks, apply dynamic themes, and manage authentication seamlessly. This gives developers complete control over the user experience, allowing them to build highly interactive, bespoke analytics experiences.
How do you handle data security and compliance in embedded dashboards?
Security in embedded analytics relies on multi-layered defenses. First, your platform should support industry-standard compliance certifications such as SOC2, HIPAA (crucial for healthcare portals), and GDPR (for data privacy in Europe).
Second, your data must be isolated using robust tenant-filtering and Row-Level Security (RLS) to ensure users only see their authorized data.
In specialized environments like IoT or industrial monitoring, edge-level processing agents or hardware-integrated sensor ecosystems can process data locally to minimize security risks before sending aggregated metrics to the cloud. For standard SaaS applications, hosting your BI backend in a secure virtual private cloud (VPC) with strict database access controls is the gold standard.
Can end-users build their own reports within an embedded platform?
Yes! Modern embedded BI platforms offer self-service capabilities that allow non-technical end-users to build their own reports and dashboards. Instead of relying on pre-built static views, users can drag and drop fields, create custom charts, and even use AI-powered natural language queries to ask questions of their data and generate visualizations instantly. This self-serve approach dramatically reduces the number of custom reporting requests your engineering and support teams have to handle.
Conclusion
When it comes to delivering analytics to your users, the build vs. buy decision is clear. Building a fully featured, secure, and responsive embedded BI dashboard from scratch requires months of dedicated engineering resources, ongoing maintenance, and significant capital. Buying an established embedded BI solution can reduce your development costs by up to 60% and get you to market in a fraction of the time.
However, the biggest challenge with buying traditional embedded BI tools is that they can lock you into a single vendor’s ecosystem. If different teams, departments, or enterprise clients rely on different analytics stacks, you can end up building separate, disjointed portals for each one.
That is where we come in.
At Embedportal (proudly based in California, USA), we provide a white-label embedding platform designed specifically to solve this multi-vendor headache. Our platform allows you to embed dashboards from the BI tools your customers already use into a single, cohesive portal. With unified branding, robust row-level security, and seamless SSO integration, you can deliver a premium, native analytics experience to your users in under an hour.
Stop wasting valuable engineering cycles building analytics infrastructure from scratch. Let your developers focus on your core product while we handle the data delivery.
Ready to see how easy it is to unify your customer-facing analytics? Explore how we simplify BI dashboard embedding to get started today!

