
Multi tenant analytics is one analytics system that serves many customers at once while keeping each customer’s data, permissions, and experience separate. If you need to give every account dashboards inside your product, but the idea of building a separate reporting stack for each one already sounds exhausting, this is the model that makes the whole thing workable.
What Multi-Tenant Analytics Actually Means
You can think of multi tenant analytics as shared plumbing with locked doors. Your customers use the same analytics platform, often the same dashboards and metric definitions too, but each tenant only sees what belongs to that tenant. No data bleed. No manual copy of every report for every account. No “enterprise customer A has a slightly older version of the dashboard because nobody pushed the update there.”
In practice, this usually shows up in customer-facing dashboards inside a SaaS app, agency reporting portals where each client logs in to see only client-specific results, and branded analytics hubs that pull together reporting from different tools behind one experience. The point is not just efficiency. The point is delivering analytics at scale without turning reporting into a custom services project every time a new account signs.
Multi-Tenant Analytics vs. Multi-Tenant Architecture
Multi-tenant architecture is the broader pattern. One application instance or shared platform serves many customers, with logic that keeps data, configuration, and access isolated. Multi tenant analytics is that same idea, narrowed to dashboards, reports, metrics, and ad hoc exploration.
That distinction matters because analytics has its own headaches. Application screens are usually predictable. Analytics is not. Users apply filters, open drill paths, run heavy queries, and expect answers fast. Research on multi-tenant analytics points out that the analytics layer has to deal with diverse datasets, historical and real-time data, user-defined filters, and expensive queries, all while preserving isolation and performance. That is a different problem from simply rendering a settings page for ten thousand accounts.
Where You’ll Run Into It
The classic example is a SaaS product that shows each customer usage trends, adoption metrics, outcomes, or benchmarks inside the app. A customer success leader logs in at 8:17 on a Tuesday morning, clicks “Analytics,” and expects a dashboard that already knows which account, users, and features matter. No extra login. No separate BI tool UI. Just answers.
Another common pattern shows up in agencies and consultancies. One reporting portal serves dozens or hundreds of clients, each with branded dashboards and limited self-service, but nobody can see another client’s campaign data.
Then there is the internal platform case. Your company may already have Power BI for one team, Tableau for another, and maybe Looker or a custom dashboard layer somewhere else. Multi-tenant analytics can sit on top as a single portal with one login, one branded shell, and one access model.
How Multi-Tenant Analytics Works Behind the Scenes
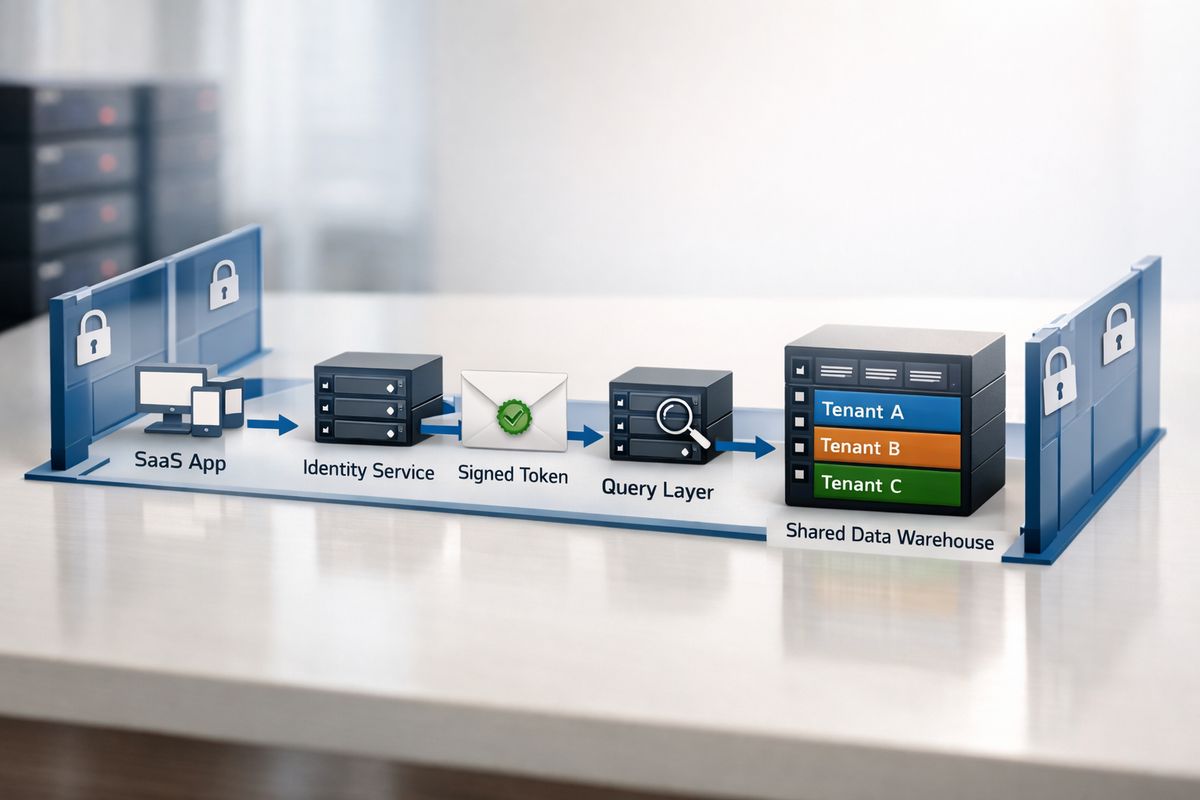
At a high level, four parts have to cooperate cleanly: your app, your identity layer, your analytics layer, and your data layer. The easiest way to picture it is a luggage tag at an airport. The suitcase is just a suitcase. The tag decides where it goes, who handles it, and where it is allowed to end up. Tenant context works the same way.
If tenant context gets passed correctly from login through query execution and dashboard rendering, users see the right analytics. If it breaks anywhere in that chain, you get the kind of bug that keeps security teams awake.
Tenant Context Flows From Your App Into the Analytics Layer
Your application usually knows the user before the analytics system does. So your app passes identity and tenant context downstream through claims, app context, or a JWT. A JWT is a signed token that tells the analytics system who the user is and which tenant belongs to that session.
That handoff is where embedded analytics becomes real instead of cosmetic. The analytics layer should not have to guess which account is active. It should receive a trusted, signed statement that includes tenant ID, role, entitlements, and sometimes user-level attributes for more granular filtering.
If you are comparing platforms for customer-facing reporting inside your product, this auth handoff is one of the first places to look. A polished iframe demo is easy. A clean, secure tenant-aware token flow is not.
Permissions Follow the User, Not Just the Dashboard
A dashboard is not a permission model. That sounds obvious, but this is where a lot of early implementations go wrong. Access control has to follow the user and the tenant context, not just the URL of a report.
Inside the same customer account, different users often need different views. An executive may see company-wide KPIs, while a regional manager sees only a subset. That means role-based access control, group mapping, and feature entitlements still matter after tenant isolation is in place. Same tenant, different data rights.
The catch is that permissions tend to sprawl. Product roles, analytics roles, customer contract rules, and feature flags all meet in one place. If those rules live in three systems with no common model, things get messy fast.
The Data Layer Enforces Isolation
Real isolation happens in the data access layer. Not in the UI. Not in a dropdown filter. Not in a bit of JavaScript that hides a chart.
That usually means row-level security, column-level security, tenant IDs in shared tables, or stronger physical separation such as schema-per-tenant or database-per-tenant. If you want a practical example of how this works in a familiar BI stack, this guide on locking data by user attributes in Power BI shows the kind of enforcement pattern teams rely on.
A shared table with a tenant_id column can work very well, as long as the query path always applies tenant-aware security before data is returned. A separate schema or database can raise the isolation bar, but it also raises operational cost. Either way, UI filters alone are not security. That shortcut eventually fails.
The Core Building Blocks of a Multi-Tenant Analytics Setup
Once you break the system into pieces, the architecture gets much easier to evaluate. You are really choosing how to handle presentation, metric logic, identity, and storage.
Shared Presentation Layer
The presentation layer is what your customers touch: embedded dashboards, white-label UI, navigation, filters, exports, and portal layout. In a good setup, one front end can still feel tenant-specific through theming, logos, navigation rules, and saved views.
That matters more than it seems. Customers expect analytics to feel native to your product, not like an unrelated BI app stuffed into a frame. If branded experience is high on your list, a buyer’s view of branded analytics controls helps separate superficial theming from actual white-label flexibility.
Semantic Layer or Metrics Layer
A semantic layer turns raw tables into business-friendly definitions. Instead of making every dashboard author calculate “active accounts” or “net retention” differently, you define it once and reuse it everywhere.
In multi-tenant analytics, that layer does extra work. It maps tenant-aware logic into reusable metrics and dimensions, which means fewer duplicated dashboards and less chance that one customer sees a slightly different formula than another. It also helps keep access logic aligned with business logic, which is a big deal once products evolve.
Identity and Authentication
Identity is part of analytics architecture, not a side topic for the security team. SSO, JWT handoff, SCIM or automated provisioning, session handling, and user lifecycle rules all affect who gets in, what gets created, and what gets revoked.
If a customer user leaves the company, access should disappear cleanly. If a new enterprise tenant wants SAML SSO with role mapping, your analytics layer should not become the bottleneck. Good identity design saves support time just as much as it improves security.
Data Storage Patterns
Most setups land on one of four patterns: shared tables with tenant IDs, schema-per-tenant, database-per-tenant, or a hybrid mix.
Shared tables are cheap and simple to operate, but they demand disciplined security and performance controls. Schema-per-tenant gives cleaner separation, though migrations and management get heavier. Database-per-tenant provides the strongest boundary, but at scale it can become a provisioning and maintenance machine that never stops. Hybrid models use shared storage where possible and stronger isolation where contracts, sensitivity, or residency rules require it.
Multi-Tenant Analytics vs. Traditional Analytics
Traditional analytics was built for internal teams. Customer-facing analytics was not.
Internal BI assumes trained users, looser branding expectations, lower concurrency in many cases, and a permission model shaped around employees. Multi-tenant analytics has to support external users who expect the whole experience to feel obvious, fast, and safe on first click.
What Changes When Analytics Becomes Customer Facing
Once dashboards leave the internal team and enter your product, the bar changes. Permissions get stricter. Branding matters more. Self-service has to be simpler. Support burden rises because customers will click everything, including the thing nobody expected anybody to click.
There is also less tolerance for confusing UX. Internal analysts will tolerate a rough edge if the data is good. Paying customers usually will not.
Why Embedded Analytics Gets Hard Fast
The embedding layer is never the easy part once real customers start clicking around. Auth handoff, tenant provisioning, permission mapping, drill paths, caching, audit trails, and traffic spikes all show up sooner than expected.
That is why “just put the dashboard in an iframe” is not a serious architecture plan. More than 50% of enterprises had implemented some form of embedded analytics by 2024, which means user expectations are now much higher. Embedded is normal. Clean multi-tenant embedded analytics is the harder part.
The Main Benefits for SaaS Teams and Their Customers
https://www.youtube.com/watch?v=ZYuu8sWUQww
The appeal is simple: shared infrastructure with strict separation gives you scale without cloning your analytics stack for every account.
Lower Cost and Faster Delivery
One shared analytics platform is usually cheaper than duplicating dashboards, logic, infrastructure, and support paths for every tenant. You define metrics once, deploy once, and reuse the same core assets many times.
That has direct buy-versus-build implications. Purpose-built platforms can shrink delivery timelines from quarters to weeks, especially when JWT auth, RLS, white-label controls, and tenant provisioning already exist instead of living on your roadmap.
Easier Scaling and Centralized Updates
A bug fix applied once is better than a bug fix applied 47 times. Multi-tenant setups let you roll out dashboard changes, metric updates, and performance improvements centrally.
That operational simplicity matters a lot for lean teams. If product analytics is owned by three people and one of them is on vacation, centralized updates are the difference between calm and chaos.
Better Customer Experience
Customers get dashboards that feel personalized without needing custom infrastructure behind each account. That can mean tenant-specific branding, account-aware filters, self-service exploration, and faster time to insight right inside the product.
And honestly, that is what customers expect now. They want analytics to feel native. Not bolted on, not visibly outsourced, not a second login from 2009.
Cleaner Operations Across Vendors and Teams
Multi-tenant analytics is also useful when your problem is not one app but too many analytics tools. If your company is trying to unify dashboards across vendors, a shared tenant-aware portal can provide one access model and one user experience over mixed back ends.
Cost evaluation matters here too, especially if licensing grows unpredictably. If pricing is part of your architecture decision, it helps to understand how embedded reporting costs tend to expand over time.
Security, Performance, and Compliance: The Parts You Cannot Fake
This is the section that decides whether your architecture is real or just pretty.
Security: Keeping Every Tenant in Their Own Lane
Security starts with least-privilege access, row-level security, column masking where needed, encryption in transit and at rest, tenant-aware permission checks, and audit logs that let you prove what happened. Shared does not mean exposed. It means isolation has to be deliberate and testable.
The risk of “just add a filter” is simple: filters can be bypassed, forgotten, or misapplied. Research from Cloud Security Alliance warns that multitenant systems only scale safely when operational and data separation are implemented correctly, otherwise you risk data bleed across accounts.
Performance: Avoiding the Noisy Neighbor Problem
One large tenant with a heavy dashboard can slow everyone else down if your architecture is weak. That is the noisy neighbor problem, and it shows up in concurrency, warehouse load, cache misses, and shared compute contention.
The usual fixes are not mysterious: caching, pre-aggregation, workload management, query optimization, autoscaling, and tenant-level monitoring. But they do need to exist. Monitoring query latency and concurrency at both the platform and tenant level is what helps you spot heavy tenants before support tickets pile up.
Compliance and Data Residency
Some customers care less about average performance and more about where data lives, who can access it, and what certification backs the environment. SOC 2 is common. GDPR matters if personal data moves across regions. HIPAA can change everything if healthcare data is involved.
This is where hybrid architecture often wins. Shared where you can, isolated where you must. That model matches real-world constraints better than ideological purity.

Common Architecture Patterns and Tradeoffs
There is no perfect tenancy model. There is only the model that fits your risk, scale, and team capacity.
Shared-Everything Model
This is the lowest-cost design: one app, one analytics layer, and one shared warehouse or database, with logical isolation through tenant-aware security. It works well when tenants have similar requirements, data shapes are consistent, and your team wants fast iteration.
The downside is obvious. Security and performance discipline have to be excellent, because more responsibility sits in logic rather than physical separation.
Isolated-by-Schema or Isolated-by-Database Model
Some teams choose stronger isolation with a schema per tenant or a database per tenant. This can make enterprise buyers happier, simplify certain compliance stories, and create harder boundaries for premium accounts.
But the price is operational drag. More provisioning. More migrations. More monitoring. More chances for version drift.
Hybrid Model
Hybrid is the practical middle ground for many B2B SaaS teams. Shared infrastructure handles common workloads, while specific tenants get isolated storage, regional deployment, or dedicated compute where needed.
That approach also fits modern infrastructure trends. Shared platforms are growing fast because of cloud adoption, AI workloads, and distributed systems demands. One market forecast values the space at USD 72.66 billion in 2024 and projects strong long-term growth, which lines up with what product teams are feeling already: more demand for scalable shared systems, but with stronger isolation expectations attached.
Build vs. Buy: How to Decide Without Regretting It Later
This decision is less about ideology and more about what kind of engineering work you want to own for the next three years.
When Building In-House Makes Sense
Building can make sense if your team already has strong platform engineering skills, highly specific UX requirements, unusual security controls, or deep investment in an internal BI stack that is genuinely working.
It also makes sense if analytics is part of your product differentiation and you need unusually custom behavior that off-the-shelf platforms cannot handle cleanly.
When Buying Saves You Time
Buying is usually smarter when timelines are tight, data engineering bandwidth is limited, and customer-facing requirements are piling up. Auth handoff, RLS, white-labeling, tenant management, embedding APIs, audit logging, and performance controls take real time to build well.
A platform built for embedded multi-tenancy can remove a lot of undifferentiated work. That is often the difference between shipping this quarter and slipping into another planning cycle.
Questions to Ask During Evaluation
Ask direct questions. Does it support JWT and enterprise SSO cleanly? How is RLS enforced? How are tenants provisioned and deprovisioned? What branding controls are real versus cosmetic? What audit logs exist? How does caching work? What happens during usage spikes? Can you migrate away later without rebuilding your app?
Pricing belongs on that list too. A product that looks cheap in a pilot can get expensive once concurrency, viewers, or compute usage climbs, which is why teams often compare details like what Power BI embedded costs in practice before committing to a direction.
Real-World Use Cases for Multi-Tenant Analytics
The architecture gets easier to understand once you picture where it shows up.
SaaS Customer Dashboards
This is the standard use case. Each customer logs in and sees usage, outcomes, benchmarks, or operational metrics tied to that account. Product analytics, financial metrics, adoption trends, SLA reporting, and team performance all fit here.
Agency and Consultancy Reporting Portals
An agency portal serves many clients from one reporting environment. Each client gets branded reports, limited self-service, maybe scheduled exports, and no visibility into any other client relationship. Same platform, hard separation.
Unified Analytics Portals Across BI Tools
Sometimes the problem is tool sprawl, not dashboard creation. A unified portal can bring together analytics from multiple BI vendors under one SSO flow, one access layer, and one tenant-aware experience, which is especially useful for internal platform teams cleaning up a messy analytics estate.
Common Misconceptions and FAQs
A few misunderstandings cause more wasted time than anything else.
Is Multi-Tenant Analytics the Same as Embedded Analytics?
No. Embedded analytics describes how analytics gets delivered inside your app or portal. Multi-tenancy describes how users, tenants, permissions, and data are isolated and managed. Many embedded setups are multi-tenant, but not all of them are.
Is Shared Infrastructure Less Secure?
Not automatically. Shared can be secure if isolation is enforced at the identity, query, and data layers, then monitored and tested. Shared without disciplined isolation is risky. That is the real distinction.
Does Every Tenant Need Its Own Database?
No. Many products work well with shared tables plus strong tenant-aware security. Separate databases are useful when compliance, data residency, contract terms, or extreme workload isolation justify the overhead.
Can You Add Multi-Tenant Analytics Later?
Yes, but retrofitting it hurts. Tenant context, permission logic, data modeling, and dashboard design are much easier to get right early. Add them late and you often lose months untangling assumptions baked into a single-tenant design.
What’s Changing in Multi-Tenant Analytics Now
The basics are stable. The pressures around them are changing.
AI Workloads Are Raising the Bar for Performance Isolation
Analytics queries are getting heavier. Forecasting, anomaly detection, AI-assisted exploration, and large-scale benchmark comparisons all increase compute pressure.
That matters because multi-tenant systems now have to protect performance under more demanding workloads. Infrastructure research points the same way. By 2026, 61% of providers are expected to expand reliance on multi-tenant colocation for overflow compute and regional deployment, largely because AI workloads are straining traditional capacity assumptions.
Hybrid and Edge Patterns Are Becoming More Relevant
More products are regional, distributed, and latency-sensitive. Some tenants want local data handling. Some need global analytics with local operational data. Some want both.
That pushes teams toward hybrid data and analytics architectures, where shared services coexist with regional storage, edge processing, or dedicated paths for specific tenants.
Efficiency Now Matters Alongside Scale
Scale still matters, of course. But efficiency is getting just as much attention. Shared platforms are attractive because they reduce duplicated compute, simplify updates, and make operations easier to centralize.
That trend is bigger than analytics alone. It sits inside a broader move toward resource-efficient shared systems, especially as power, cloud spend, and engineering time all get more expensive.

A Simple Way to Start
Map one customer-facing analytics flow from end to end: login, tenant claim, permission check, query path, and dashboard render. Do it on one whiteboard or one doc. No abstractions. Just the actual path.
That single exercise reveals almost everything. You will quickly see whether tenant context is consistent, whether security is enforced in the right layer, whether your embedding approach is doing real work, and whether your current stack is ready for multi tenant analytics or quietly begging for a platform built for it.
Frequently Asked Questions
What is the difference between tenant isolation and user permissions?
Tenant isolation separates one customer account from another. User permissions decide what specific people inside the same tenant can access. You need both. Tenant isolation alone does not solve manager-versus-admin visibility inside one customer account.
Can multi-tenant analytics work with existing BI tools?
Yes, if your BI tools support secure embedding, identity handoff, and data-level security. The harder part is often creating one consistent portal, branding layer, and permission model across those tools.
Is schema-per-tenant better than shared tables?
Not universally. Schema-per-tenant gives stronger separation and can simplify some enterprise requirements, but it adds operational overhead. Shared tables are usually easier to scale and maintain if your row-level security model is solid.
How do you test multi-tenant analytics safely?
Test at multiple levels: token generation, role mapping, query execution, and rendered dashboards. You want automated checks that prove one tenant cannot access another tenant’s rows, exports, filters, or drill paths, even under edge cases.
Why do teams underestimate the work involved?
Because the first demo often looks deceptively easy. A sample dashboard embedded for one account is simple. Production-grade tenant provisioning, SSO, RLS, caching, auditability, support workflows, and cross-tenant safety are where the real work starts.