
Looking up power bi embedded pricing is weirdly unsatisfying. You see an A1 number, maybe feel a little relief, then realize you still have no idea what next month’s bill will look like once real traffic, authors, refresh jobs, and uptime get involved. The short version is simple: Power BI Embedded is a capacity bill, not a per-viewer bill, and your actual cost depends more on usage pattern and architecture than on the first price you saw.
Why the sticker price is only the start
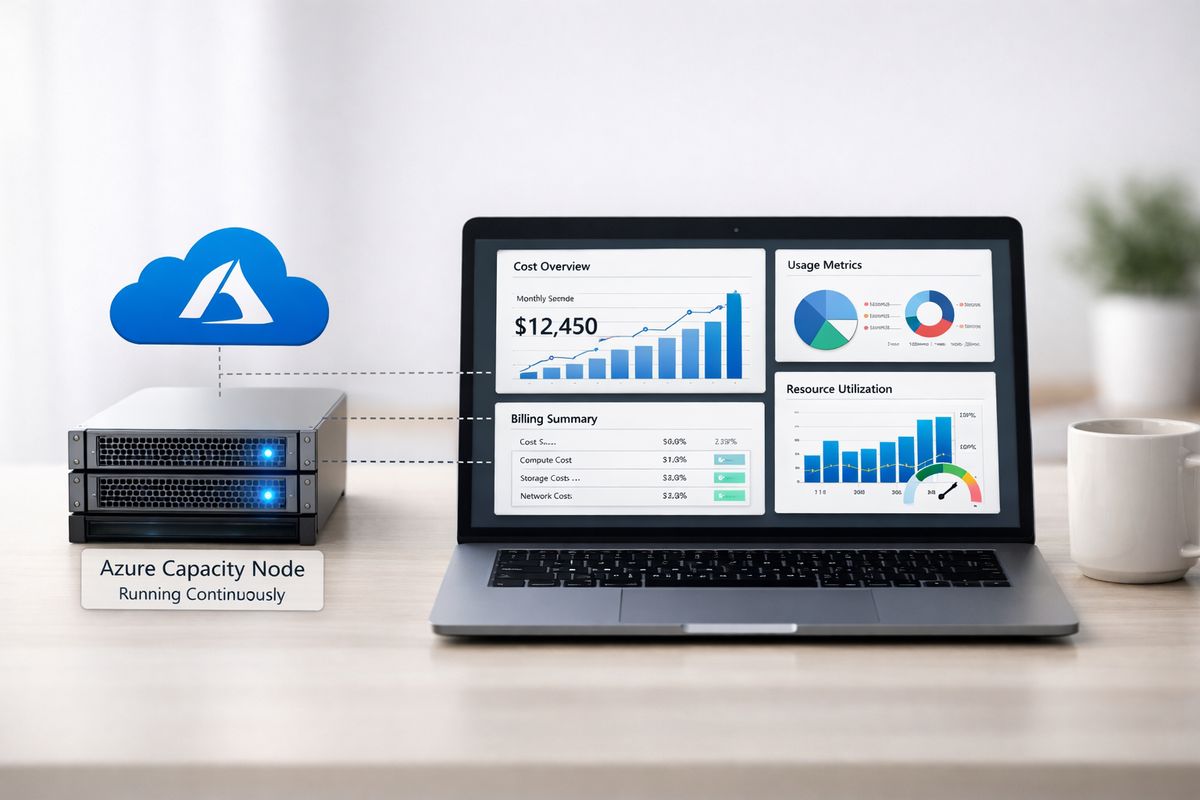
The headline price is just the entry point. What you are really buying is compute and memory capacity for embedded analytics, and that capacity behaves more like rented infrastructure than like a SaaS seat license.
That changes the budgeting logic completely.
If you are shipping dashboards into a customer portal, an account management app, or a multi-tenant reporting layer, the bill is driven by three things: how big the capacity is, how long it stays on, and how hard your reports hit it. An A1 that runs all day every day is one budget. The same A1 used only during business hours is a different budget. An A1 that looks fine in a demo but chokes during month-end reviews can quietly turn into an A2 or A3 decision.
That is why pricing research without workload planning usually goes sideways. The list price tells you the meter rate. It does not tell you what your architecture will force you to buy.
How Power BI Embedded pricing actually works
https://www.youtube.com/watch?v=6AAeV3bSMso
At the most basic level, Power BI Embedded charges for Azure capacity. Microsoft publishes a set of A-SKUs, each with a fixed amount of virtual cores and RAM. You choose a capacity size, deploy it in Azure, and pay based on how long that capacity runs.
This is a very different model from buying named user licenses for everyone who will look at a report. If your use case is customer-facing analytics, that difference is the whole point.
Microsoft describes the service as hourly billing tied to the node type you deploy. Usage is computed to the second and rounded into billed hours. In practice, that means 12 hours and 15 minutes counts as 12.25 hours, and 6 minutes counts as 0.1 hour. Not mysterious, just infrastructure math.
You pay for Azure capacity, not for every customer who views a dashboard
For app-owns-data setups, which are common in SaaS products and client portals, your external viewers generally do not need individual Power BI licenses. That is the biggest pricing advantage in the whole model.
If you have 40 customers or 4,000 customers viewing embedded dashboards inside your app, the billing question is not “How many viewer licenses do you need?” The question is “How much capacity do those sessions consume at the same time?” For a B2B product, that can make Power BI Embedded far cheaper than per-seat licensing once usage scales.
This is also why it shows up so often in customer-facing analytics inside SaaS products. When your app owns authentication, token generation, and the embedding flow, you can package analytics as part of the product instead of turning every viewer into a licensed Power BI user.
The meter keeps running unless you pause capacity
Here is the catch: capacity keeps billing while it is running, even if nobody is looking at a dashboard.
An A1 that runs 24/7 costs one thing. An A1 that runs only 10 hours a day on weekdays costs dramatically less. Microsoft states that if capacity is paused, embedded content will not load and you are not charged for the service during that pause.
That matters most for low-traffic environments, regional portals with predictable business hours, and non-production environments. It matters less for global products, executive reporting with unpredictable access, or anything with a hard uptime expectation. If customers log in at 9:07 p.m. and expect dashboards to work, pause strategy gets harder fast.
Authors and publishers still need licenses
Power BI Embedded is not a free pass for everyone involved. The people creating, publishing, and managing the content still need Power BI Pro licenses.
That line item is small compared with capacity, but it gets forgotten all the time. Microsoft’s licensing guidance says publishers need Pro, and current pricing context puts Pro at about $14 per user per month after the 2025 increase. Three report builders add up to only a few hundred dollars a year, which is not huge, but it is still part of your landed cost.
Current Power BI Embedded pricing by SKU
The current A-SKU list prices give you a baseline, not a final quote. Microsoft also notes that displayed prices are estimates only, and actual pricing can vary by agreement, region, currency, and purchase date.
Still, the published numbers are useful because they show how quickly costs scale as you move up capacity.
A1 through A6 pricing at a glance
Here is the current Microsoft pricing snapshot for Power BI Embedded A-SKUs:
| SKU | vCores | RAM | Monthly list price |
|---|---|---|---|
| A1 | 1 | 3 GB | $735.913 |
| A2 | 2 | 5 GB | $1,465.913 |
| A3 | 4 | 10 GB | $2,937.666 |
| A4 | 8 | 25 GB | $5,881.245 |
| A5 | 16 | 50 GB | $11,768.33 |
| A6 | 32 | 100 GB | $23,542.938 |
| A7 | N/A | N/A | N/A |
| A8 | N/A | N/A | N/A |
Microsoft’s pricing page shows this A1 to A6 range and lists A7 and A8 as unavailable. Those monthly figures are useful shorthand, but remember that the platform is really billed hourly. The monthly view assumes continuous operation.
What each SKU usually means in the real world
A1 is usually where testing, pilots, and very light production workloads start. Think small internal portals, early customer analytics rollouts, or an agency portal with modest concurrency and fairly simple reports.
A2 and A3 are where many real production deployments begin to feel comfortable. If you have interactive usage, modest concurrency, a few more complex visuals, and actual customer expectations around response time, this is often the zone you end up evaluating first.
A4 and above are not just “more users.” At that point, you are often dealing with heavier concurrency, larger semantic models, more demanding refresh schedules, more memory pressure, or simply less room for performance dips. Once customers are clicking through filters in parallel during a quarterly review, the capacity conversation stops being theoretical.
What you’ll really pay in common deployment scenarios
The list price gets clearer once you attach it to an operating model. Same SKU, different runtime pattern, very different bill.
If you run capacity 24/7
Running capacity around the clock is the easiest budget to understand and the easiest one to underestimate.
If your environment must always be available, your monthly spend will land close to the published list price for that SKU. That means roughly $736 per month for A1, about $1,466 for A2, about $2,938 for A3, and so on. This makes sense when usage is steady, customers are spread across time zones, or the product promise includes always-on analytics.
It also makes sense when operational simplicity matters more than squeezing every dollar. A paused environment saves money, but it introduces orchestration and the chance that somebody opens a dashboard while the capacity is asleep. For customer-facing software, simplicity often wins.
If you pause nights and weekends
Pausing can cut spend materially for low-traffic or business-hours-only use cases.
Say your portal only needs to be live from 8 a.m. to 6 p.m., Monday through Friday. That is about 50 hours a week instead of 168. Even after rounding and a little operational cushion, the monthly cost can fall by roughly two-thirds compared with running full time. Some implementation guides even describe savings around 70 percent for environments with limited operating windows.
That is especially attractive for dev, QA, staging, and regional customer portals. If your customer base sits mostly in one geography and dashboard usage looks a lot like a normal office schedule, pause and resume automation can turn a scary line item into a manageable one.
If your usage spikes at month-end or during customer reviews
This is where teams get surprised.
Average traffic does not buy your SKU, peak concurrency does. If your dashboards are mostly quiet but suddenly light up at month-end close, during quarterly business reviews, or right before board packets go out, the platform still has to survive the rush. A small capacity that looks cheap for 27 days can become expensive if performance problems force a bigger SKU for the other 3.
Here is where good workload design matters. Report complexity, query shape, refresh timing, and tenant isolation all influence peak behavior. If your app serves many customers at once, it helps to understand the mechanics of shared analytics across tenants, because isolation choices can change both performance and cost.
The pricing traps that catch buyers most often
Most pricing mistakes are not math mistakes. They are category mistakes.
Mixing up Embedded, Pro, PPU, Premium, and Fabric
This messes up budgets constantly because the names sound related, but the buying logic is different.
Power BI Embedded is the Azure capacity model built for embedding analytics into applications. Pro and Premium Per User are per-seat licenses that fit internal collaboration and self-service use cases. Older Premium capacity conversations also get tangled in here, and now Fabric adds another layer. Microsoft’s own documentation separates these capacity families for a reason.
If your goal is customer-facing analytics inside your own product, Embedded is usually the pricing model you should examine first. If your goal is sharing dashboards inside your company through the Power BI service, that is a different licensing discussion entirely.
Assuming app-owns-data and user-owns-data cost the same
They do not, because the architecture is different and the license implications are different.
App-owns-data is usually the better fit for SaaS and external portals. Your application authenticates, generates the embed token, and presents the report to the customer inside your own experience. That setup is what makes the no-license-for-viewers math work.
User-owns-data is more natural when people already live inside Microsoft identity and Power BI. But for external customer analytics, it can pull you back toward individual license requirements and a more awkward operating model. If you are still sorting out the basics, it helps to get clear on how embedded BI works in practice before you compare cost models.
Forgetting the non-Microsoft costs
This is the trap that hurts most, because the Azure number looks clean and the implementation work does not.
Power BI Embedded is not a turnkey white-label analytics product on its own. You still have to handle token generation, JWT signing, SSO, tenant-aware routing, row-level security, branding, monitoring, error handling, and support. If your reports need strict tenant isolation, you also need to validate your Power BI security model early, not after customers are already in production.
And then there is the less glamorous work: usage monitoring, capacity tuning, release coordination, and support tickets that start with “the dashboard feels slow” and end in a deep dive on one ugly visual.
How to estimate the right budget for your use case
Budgeting gets easier once you stop treating this like a licensing puzzle and start treating it like a workload sizing exercise.
Start with concurrency, not total user count
Total users are a weak signal. Ten thousand named users can be cheap if only 40 are active at once. Two hundred users can be expensive if 120 hit the same dashboard at 9 a.m. on the first business day of the month.
That is why concurrency is the first number to get right. How many sessions run at the same time? How interactive are those sessions? Are people opening a static KPI page, or slicing a dense report with lots of visuals and cross-filtering? Cost follows simultaneous demand much more than account count.
Factor in model size, refresh frequency, and report complexity
A cheap SKU can feel expensive quickly when the workload gets heavy.
Large imported models consume memory. DirectQuery can push latency elsewhere and still create painful user experience if source systems are slow. Frequent refreshes compete for capacity. Complex visuals and badly designed reports increase render time and CPU pressure. If the portal experience matters, report design is not just a BI concern. It is a cost concern.
This is also where “small pilot” assumptions break. A dashboard that looked fine in a conference room demo can behave very differently once customers start filtering across multiple pages at the same time on a Tuesday afternoon.
Budget for testing, monitoring, and one step up from your first guess
Do not buy capacity like you are picking a phone plan and hoping for the best.
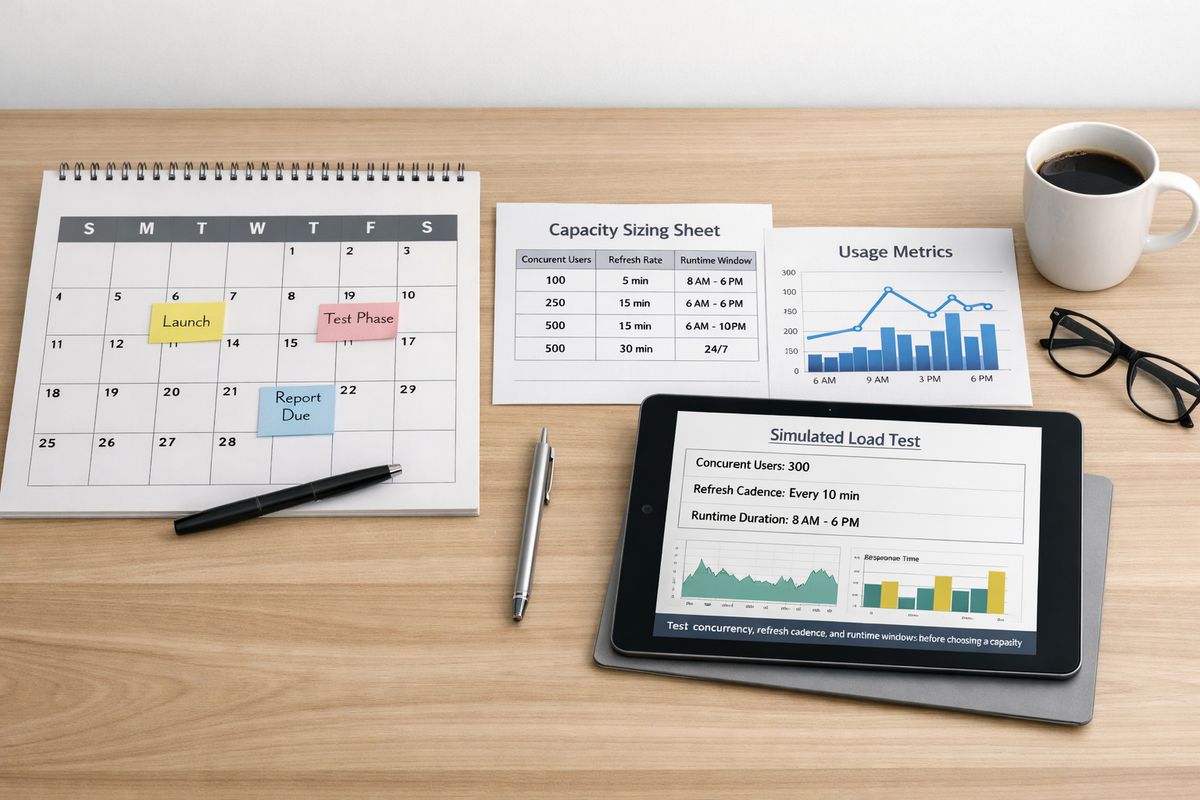
Estimate your likely concurrency. Map that against model size and usage windows. Test with realistic traffic. Monitor render time, failures, and memory pressure. Then keep room in the budget to move up one SKU if production proves your first estimate optimistic.
That last part matters. Capacity sizing is an engineering exercise with procurement consequences, not a procurement exercise with a little engineering attached later.
When Power BI Embedded is a good deal , and when it isn’t
Power BI Embedded can be a very good deal. It can also look cheap on paper and end up expensive once engineering reality shows up.
Best fit: external customer analytics at scale
The economics work best when you need to serve lots of external viewers without buying a seat for every one of them.
That is the sweet spot for SaaS products, partner portals, customer success hubs, and agency reporting environments. If analytics is part of your product experience, capacity pricing usually makes more sense than viewer licensing. The more your audience grows, the more that advantage tends to matter.
Less ideal: low-volume use cases with heavy customization needs
If your audience is small and your UX requirements are demanding, the Azure line item may not be the main cost.
Custom navigation, strong white-labeling, unusual permission rules, complex tenant switching, and tight product integration all add engineering effort. In those cases, the capacity bill can be reasonable while the total project cost still feels high. That is often where teams start comparing Power BI with broader white-label reporting options rather than just comparing SKU prices.
Compare the bill to the cost of building your own embedding layer
Here is the honest comparison: Power BI Embedded is not just competing with another BI license. It is also competing with the cost of building and maintaining your own embedding layer.
That layer includes auth flows, embed token handling, tenant isolation, RLS, SSO, usage telemetry, front-end integration, and the ongoing work to keep the experience polished. If your team already has a lot of this infrastructure, Power BI Embedded may slot in neatly. If not, the Azure charge is only one piece of the business case.
A simple checklist before you commit
https://www.youtube.com/watch?v=lQpBi4vDF6k
At some point, you need a decision rule, not another pricing table.
Questions to answer before choosing a SKU
Use this shortlist before committing to any capacity:
- App-owns-data or user-owns-data
- Expected peak concurrency
- Required uptime window
- Number of report authors
- Dataset size and refresh cadence
- Regional traffic patterns
- Whether pause and resume is realistic
If you cannot answer those cleanly, you do not have a pricing estimate yet. You have a guess.
The safest next step for getting a real number
The fastest way to turn confusing list prices into a real budget is to model one realistic workload in the Azure calculator, then test it against your actual traffic pattern.
Not a perfect future-state estimate. One realistic scenario.
Pick a likely SKU, define the runtime window, include your author licenses, and sanity-check the workload against peak usage rather than average usage. That one exercise usually tells you more than an hour of reading pricing pages.
Frequently Asked Questions
Does Power BI Embedded charge per viewer?
No, not in the usual app-owns-data model for external users. You pay for Azure capacity, and viewers of embedded content generally do not need individual Power BI licenses. Your cost rises when capacity needs rise, not because one more customer opened a dashboard.
What is the cheapest Power BI Embedded option?
The published entry point is A1 at $735.913 per month on Microsoft’s pricing page, assuming continuous operation. If you pause capacity during off-hours, your actual monthly spend can be lower because billing is based on runtime.
Do report creators still need Power BI Pro?
Yes. Anyone publishing or managing content for embedded use still needs Power BI Pro. Current pricing context puts Pro at about $14 per user per month, so it is a small but real line item to include.
Is Power BI Embedded cheaper than Fabric for embedding?
Sometimes, yes. For embedding use cases where cost control matters, A-SKUs are often attractive because you can pause and resume them. Fabric introduces a different capacity model and may make more sense in broader Microsoft analytics setups, but it is not automatically the cheaper option for every embedded scenario.
How do you choose between A1, A2, and A3?
Start with workload, not ambition. A1 often fits development, proof of concept, and light production use. A2 or A3 is more common once concurrency, model size, and customer expectations increase. The right answer comes from testing realistic traffic, not from counting total customers.
What usually gets left out of a Power BI Embedded budget?
Implementation and operations. Teams often forget token generation, SSO setup, row-level security, monitoring, support, performance tuning, and the engineering work required to make embedded analytics feel native inside the app.
Once you see Power BI Embedded as infrastructure plus implementation, the pricing gets much easier to judge. Try one realistic calculator model with your actual uptime window and peak concurrency, and the fog clears fast.