Building customer-facing reporting sounds simple until you hit the ugly parts: tenant isolation, JWT signing, SSO handoffs, exports, caching, and the moment someone asks why Acme can see BetaCorp’s data. That is why embedded analytics for SaaS has become such a practical product decision, not just a data feature. Put plainly, it means dashboards, reports, and exploration live inside your app so customers get answers in context, without another login, another tab, or another BI product to learn.
What Embedded Analytics for SaaS Actually Means
Embedded analytics for SaaS is analytics delivered inside your software product instead of beside it. Your users open your app, click into an account, a project, a campaign, or a billing screen, and the charts, filters, KPIs, and drilldowns are already there.
That sounds obvious, but the difference matters. Internal BI helps your own team understand the business. Embedded analytics helps your customers use your product better. It sits inside the workflow where decisions happen, which is why demand keeps rising. Gartner expects more than 60% of new business applications to ship with embedded analytics by 2027, up sharply from just a few years earlier.
Embedded Analytics vs. Traditional BI
Traditional BI is built for analysts, operators, and internal stakeholders. It usually assumes a separate login, a separate data model, and a user who is willing to spend time learning the tool. That is fine for internal reporting. It is not fine when your customer is trying to answer a question in the middle of work.
The hard part is almost never drawing a bar chart. The hard part is making sure each tenant sees only the right data, every filter respects permissions, branding matches your product, and the experience feels native. If you are sorting through terms, it helps to separate embedded SaaS reporting from broader in-product BI concepts, because the SaaS version adds multi-tenancy, customer auth, and white-label concerns that internal BI often skips.
Where It Shows Up in Real SaaS Products
You can spot embedded analytics anywhere a user needs a fast decision. A revenue platform might show monthly recurring revenue, churn trends, and account expansion inside the customer workspace. A support platform might show SLA breaches, ticket backlog, and first-response time by channel. A marketing product might surface campaign ROI, cost per acquisition, and funnel drop-off before budget gets shifted.
Same pattern, different domain. Project management tools use it for delivery status and utilization. Finance platforms use it for variance reporting and working capital. At 4:47 p.m. on a Friday, when someone needs to explain why gross margin slipped or why support queue volume spiked, nobody wants a redirect to a separate analytics stack.
Why Embedded Analytics Is the Fastest Path to Launch
Here is the direct claim: buying an embedded analytics layer is usually the fastest way to ship customer-facing insights. Not a little faster. Meaningfully faster.
That is because building analytics from scratch rarely means building “a dashboard.” It means building a product layer with security, governance, and lifecycle management attached to it. Buying a purpose-built platform lets you start with infrastructure that already knows how to embed, authenticate, isolate tenants, and scale.
The Real Cost of Building the Embedding Layer Yourself
The hidden work shows up fast. You need auth flows that support SSO and signed sessions. You need row-level security so every query respects customer boundaries. You need dashboard management, audit logs, caching, exports, alerting, theming, and a way to keep all of it maintainable after launch.
That is why build estimates get expensive. Toucan’s 2026 analysis puts in-house delivery at $181,000 to $310,000 in year one and much higher over three years, while buying is typically lower over that same period. More important than the headline number is the timeline: time to first dashboard is often 6 to 12 months if you build, versus 4 to 8 weeks when you buy.
The catch is that buying is not instant either. You still need integration work. You still need to map roles, define metrics, and test tenant isolation. But that work is implementation, not reinvention. If you want a deeper look at the billing side before you commit, it is worth understanding how pricing models and hidden fees stack up.
Why Speed Matters More Than Feature Perfection
A useful v1 launched in six weeks beats a perfect analytics platform still in backlog grooming two quarters later. Customers do not reward elegant internal architecture they never see. They reward faster answers, fewer support tickets, and reporting that fits the job they are already doing.
Shipping earlier also changes the business conversation. Sales gets a concrete reporting story. Customer success gets a retention lever. Product gets usage data on what people actually click, export, and ignore. And engineering avoids sinking months into plumbing that, while necessary, does not differentiate the product on its own.
Research keeps pointing in the same direction. Embedded dashboards are associated with stronger product stickiness and lower churn, though vendor-supplied ROI claims should be treated as directional rather than absolute. Even so, the pattern is clear: in-app answers increase adoption because the friction is lower.

The Business Case: Buy vs. Build Without the Hand-Waving
This decision usually gets framed as flexibility versus speed. That is too simplistic. The real comparison is strategic value versus opportunity cost.
If analytics supports your product, buying usually wins. If analytics is your product, building can make sense. Everything else is just detail.
When Buying Is the Right Call
Buying is the right call when customers need reporting as part of the experience, but your product’s real value lives elsewhere. Think CRM, fintech operations, healthcare workflow, logistics, support, HR, martech. In those products, analytics makes the app stronger, stickier, and easier to justify, but it is not the entire reason customers pay.
In that case, the opportunity cost of building is brutal. Every month spent rebuilding embedding, auth, and white-label controls is a month not spent on your actual roadmap. That tradeoff gets even sharper if your team is already stretched across security work, AI projects, or platform maintenance, which is common right now.
When Building Still Makes Sense
Building still makes sense in a narrower set of cases. If your analytics model is the differentiator, deep custom logic drives the product, or compliance requirements rule out third-party platforms, control may outweigh speed. The same is true if your long-term platform strategy depends on owning every layer end to end.
But be honest about the tradeoff. Building buys control, not simplicity. You still need permanent ownership for security, scale, bug fixes, and feature requests. Toucan’s comparison suggests that ongoing support alone can consume half to one full engineering role over time, which is easy to underestimate during planning.
A Simple Decision Test for SaaS Teams
Try this rule: if your pre-launch checklist includes SSO, RBAC, tenant-aware filters, white-labeling, customer admin controls, exports, and auditability, you are not building “just a dashboard.” You are building a product subsystem.
That is usually the moment the decision gets clearer. If that subsystem is not core to your differentiation, buy it.
The Non-Negotiable Features to Look For in Embedded Analytics for SaaS
Feature lists get noisy fast, so it helps to ignore the pretty-demo extras and focus on what actually affects launch speed, risk, and long-term fit.
Multi-Tenancy, RBAC, and Row-Level Security
Tenant isolation matters more than visual polish. If your platform cannot reliably keep one customer’s data invisible to another, nothing else matters.
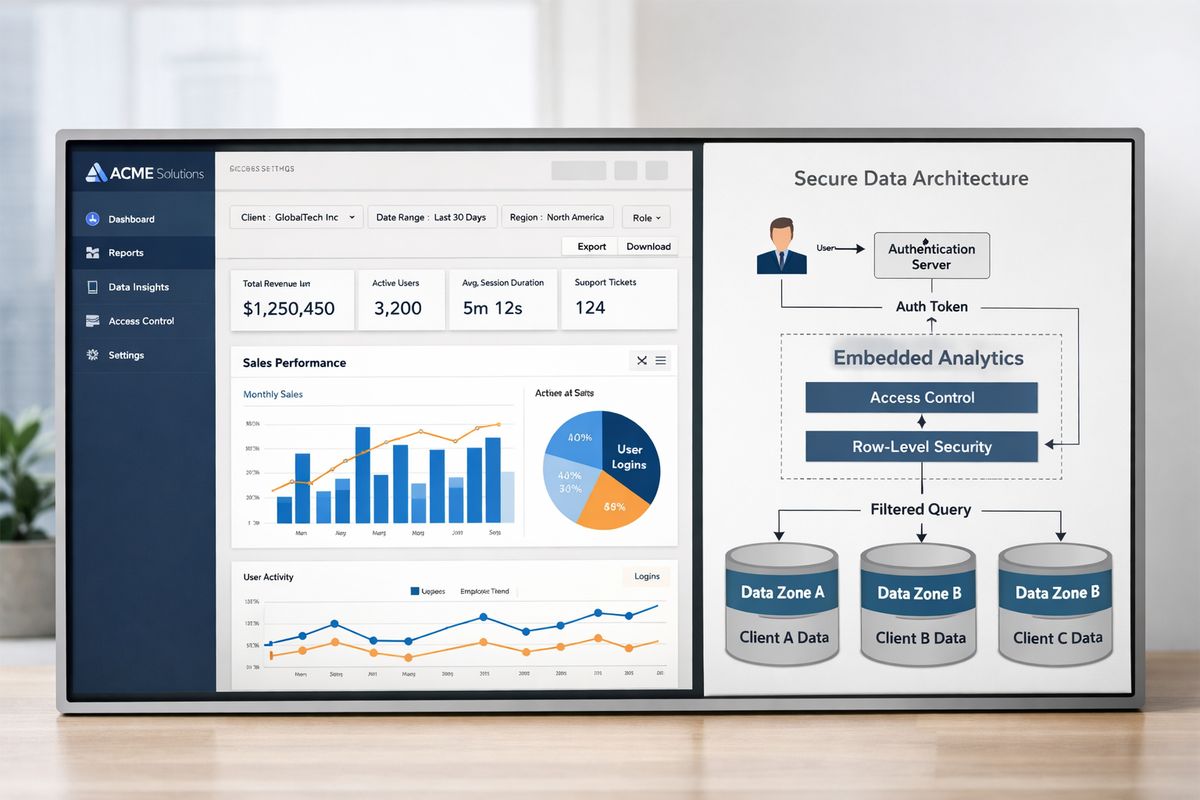
Look for role-based access control, row-level security, and governed metrics. In simple terms, RBAC decides who is allowed to access what. Row-level security decides which records get returned in a query. Governed metrics keep “revenue” or “active users” defined one way instead of twelve conflicting ways. If your stack includes Power BI or Tableau in the mix, these guides on setting up secure filters in Power BI and comparable controls in Tableau are useful reality checks.
SSO, JWT, and Secure Embedding
This is where engineering leaders stop nodding and start reading the docs. SSO keeps access smooth. JWTs create trusted, signed sessions between your app and the embedded analytics layer. Secure embedding makes sure authorization is enforced server-side, not faked in the browser.
Good vendors can explain token signing, token lifetime, tenant claims, session refresh, and how cached queries stay isolated. Bad vendors talk vaguely about “secure access” and move on. Do not let that slide. One access bug can wipe out months of trust in a single afternoon.
White-Labeling and Native Product Experience
There is a big difference between “analytics inside your app” and “an iframe bolted onto your app.” Your users notice. So does your sales team.
Look for theming, navigation control, flexible layout options, domain control, and embedding patterns that let analytics feel native. If branded experience is a selling point, this is one of the better places to study what white-labeled reporting actually needs before a demo turns into a design compromise.
Self-Service, No-Code, and Admin Controls
Your team should not become the dashboard help desk. Customer admins need to create views, save filters, schedule emails, export results, and manage access without filing tickets for every small change.
That is why self-service matters. Research also shows embedded self-service BI is now widely treated as a must-have, not a nice extra. The fastest-growing products are not just showing dashboards, they are giving controlled flexibility to non-technical users.
Performance, Caching, and Real-Time Data
Users rarely care how elegant your query engine is. Users care that a dashboard loads fast, filters respond quickly, and the numbers feel current.
That means checking caching strategy, concurrency behavior, incremental refresh, and what happens when a large tenant hammers the system Monday morning. Real-time matters for support ops, operational monitoring, and some finance workflows. For many other cases, fresh-enough beats real-time if it keeps performance predictable.
AI and Natural-Language Analytics
Search, summaries, anomaly hints, and natural-language questions are quickly becoming expected. Useful, yes. Magic, no.
AI works best when it sits on top of governed metrics and controlled access. Without that foundation, natural-language answers can be fast and wrong, which is a terrible combination. Treat AI as an acceleration layer, not a substitute for data modeling or security.
How to Launch Embedded Analytics Without Dragging the Project for Six Months
Fast launches come from narrow scope and boring discipline. Not heroic effort.
Step 1: Map Your Data Model and Customer Boundaries
Start with source systems, tenant keys, roles, and metric definitions. Decide what each persona can see, what counts as a shared definition, and where access rules get enforced. Clean rules here prevent painful rewrites later.
If multi-customer isolation is still fuzzy, spend time on how tenant-aware reporting works in practice before touching UI details.
Step 2: Start With One High-Value Use Case
Pick one reporting workflow with obvious value. Account performance, support SLA visibility, usage reporting, financial variance, campaign ROI. One good dashboard set tied to one job beats an “analytics center” packed with half-used widgets.
This also makes vendor evaluation easier. You can test the platform against a real problem instead of a generic feature matrix.
Step 3: Choose the Right Embedding Pattern
Iframes are fast. SDKs and API-driven components give more control. Full analytics portals make sense when you need a broader reporting destination with customer admin controls and cross-dashboard navigation.
The trick is to match the pattern to the product. If native UX matters, SDK or component-based embedding usually ages better. If speed matters above all and the use case is simple, an iframe can be enough for v1.
Step 4: Test Security, Scale, and UX Before Broad Rollout
Run tenant-isolation tests. Check permission edge cases. Test exports, mobile layouts, and filter behavior under load. Review what happens when a user loses access mid-session. Verify the experience feels like part of your app, not a sidecar.
This is the unglamorous work that saves you later. Security bugs are bad. Security bugs in customer-facing analytics are worse.
Common Mistakes That Slow SaaS Teams Down
The usual problems are not mysterious. Most are scope mistakes disguised as ambition.
Treating Analytics Like a Front-End Widget
Charts are the visible tip of the iceberg. Underneath sit data modeling, access control, governance, observability, and support workflows. Ignore that, and the launch gets slow fast.
Letting Every Customer Define Metrics Differently
Custom metrics sound customer-friendly until support starts explaining why “active account” means three different things across three dashboards. Keep a governed core metric layer, then allow controlled flexibility on top.
Ignoring Admin Experience and Support Workflows
If customer admins cannot manage users, exports, subscriptions, or dashboard access, all of that work lands back on product, support, or solutions teams. That gets expensive fast, and it kills adoption because simple requests start taking days.
Overbuilding Before Proving Demand
Do not try to launch exploration, alerts, AI summaries, custom builders, and a reporting marketplace in one release. Start with one use case, learn from usage, then expand. Boring advice, but it works.
How to Evaluate Embedded Analytics Vendors for Your SaaS Stack
Ignore the chart gallery for a minute. The best vendor fit usually shows up in security answers, implementation details, and maintenance burden.
Questions to Ask in the Demo
Ask how tenant isolation is enforced. Ask how JWT signing works and where claims get validated. Ask about SSO, SCIM, audit logs, concurrency, and whether theming needs hacks. Ask what breaks at ten times your current viewer scale.
The right answers are concrete. The wrong answers are vague, polished, and suspiciously short.
Red Flags That Show Up After Procurement
Weak docs are a warning sign. So are fuzzy security explanations, limited API control, painful migration paths, or pricing that punishes growth. Be especially careful with licensing models that look cheap for one creator and 100 viewers, then get ugly when a big customer rolls out company-wide.
Proof Points That Matter More Than Pretty Charts
Implementation speed matters. Security model matters. Admin controls matter. Observability, uptime, and maintainability matter. Pretty charts are table stakes.
If a platform can show safe multi-tenancy, fast integration, and predictable scaling, that is more valuable than the flashiest demo in the room.
Embedded Analytics Use Cases That Win in the Real World
The best use cases are tied to decisions, not dashboards for their own sake.
Customer-Facing Dashboards in B2B SaaS
Common wins include usage analytics, ROI reporting, operational monitoring, executive summaries, and account health. These work because they answer the questions customers already have inside the product: Is adoption growing? Where is value coming from? What needs attention now?
Branded Client Portals for Agencies and Consultancies
Agencies and consultancies often need one reporting layer across many clients, with different data sources, permissions, and branding expectations. Embedded analytics is a clean way to replace slide decks, scattered BI links, and manual reporting churn with a portal that feels consistent and professional.
Internal Portals That Unify Multiple BI Tools
Internal IT and data platform teams use embedded analytics to create a single branded portal on top of multiple BI vendors. That can simplify access control, reduce tool sprawl, and give users one place to find dashboards instead of a maze of links and permissions.
Your Fastest Next Move
Pick one customer-facing reporting use case. Write down the tenant rules, access roles, SSO needs, export needs, and branding requirements it must support. Then look at that list honestly.
If it reads like a small platform, buying will probably get you to launch faster than building. Try that exercise now, on one real use case, and the right path usually becomes obvious.
Frequently Asked Questions
What is embedded analytics for SaaS in simple terms?
It is reporting and analysis built directly into your SaaS product. Your customers can view dashboards, filter data, and answer questions inside the app instead of opening a separate BI tool.
Is buying embedded analytics always better than building?
No, but buying is usually better when analytics supports your product rather than defining it. Building makes more sense when analytics is the main differentiator or when unusual compliance and architecture requirements block third-party tools.
How long does embedded analytics take to launch?
A bought platform can often get a first version live in 4 to 8 weeks, assuming your data model and access rules are reasonably clear. Building from scratch often takes several months because you are creating security, embedding, and admin infrastructure along with the dashboards.
What security features matter most for SaaS analytics?
Multi-tenancy, role-based access control, row-level security, SSO, signed tokens such as JWTs, and audit logs matter most. In customer-facing analytics, access control failures are far more damaging than missing chart features.
Do you need real-time data for embedded analytics?
Not always. Real-time matters for operational use cases like support queues, monitoring, or live financial movements. For many dashboards, near-real-time or scheduled refresh is enough if performance stays fast and data stays trustworthy.
Can embedded analytics become a revenue feature?
Yes. Many SaaS products use analytics to improve retention, support premium plans, or create add-on reporting packages. The strongest monetization usually comes when the analytics directly helps customers make better decisions inside the product.