Embedded data analytics is customer-facing reporting that lives inside the product your users already use. If you need to show dashboards, trends, and exports without sending customers off to a separate BI tool, this is the category you’re looking at, and it matters because the hard part is rarely the chart itself. It’s the identity, security, tenancy, and product experience wrapped around it.
What Embedded Data Analytics Actually Means
At the simplest level, embedded data analytics means putting analytics inside your application, portal, or branded workspace so users can see and act on data without leaving the flow of work. Instead of emailing a PDF, linking out to Tableau, or asking customers to log into a separate reporting app, you present the insight right where it’s needed.
That distinction matters more than it sounds. A standalone internal dashboard is usually built for operators, analysts, or executives inside your company. Embedded analytics is built for end users inside a product experience. Different audience, different expectations, different failure modes.
Think of it like putting the speedometer inside the car instead of asking someone to check speed on a different website every ten minutes. The information is the same in theory, but the usability is completely different.
A simple example from a real SaaS workflow
Picture a customer success manager opening a client portal at 9:12 a.m. before a renewal call. Inside the account view, the manager sees weekly active users, feature adoption, unresolved tickets, and a usage trend line for the last 90 days. No new login. No tab switch. No “hang on while I pull the report.”
That feels seamless because it is. The analytics are part of the product, not a side trip. For the end user, that changes the experience from “go find reporting” to “the product already knows what I need.”
Embedded analytics vs. linked-out reporting
A lot of teams say “embedded” when the setup is really just a navigation link to another BI app. That is not the same thing.
Linked-out reporting sends users into a separate environment with separate branding, different navigation, and often a second authentication step. Even when single sign-on softens the handoff, users still feel the seam. The reporting experience belongs to another tool.
True embedded analytics keeps the experience inside your app or portal. The embedding layer, identity mapping, permissions, and UI integration are the difference. You control how analytics appear, how users get access, and how the whole thing fits into the rest of your product.
How Embedded Analytics Works Under the Hood
Under the hood, embedded analytics is a chain. Data starts somewhere, gets cleaned and modeled, runs through a query or analytics engine, and shows up as charts or reports inside your app through an embed method.
That sounds abstract, but the flow is pretty practical. Source systems feed a warehouse or operational store. A modeling layer turns raw fields into stable business metrics. A BI or analytics engine runs queries and renders visuals. Your application authenticates the user, passes identity and permission context, and displays the result in a container, SDK component, or custom front-end.
If any part of that chain is shaky, users notice fast. Broken metric definitions create mistrust. Weak permission handling creates risk. Slow queries make the whole feature feel bolted on.
The core pieces: data, queries, visuals, and the host app
Start with data. This can come from your app database, warehouse, lakehouse, or a mix of product and third-party systems. Raw data alone is not enough, because customer-facing reporting needs stable definitions for things like active users, revenue, account health, or conversion rate.
Next comes the query and modeling layer. This is where fields become metrics and dimensions that make sense to users. If “monthly active user” means one thing in sales dashboards and another thing in customer portals, you have a trust problem, not a chart problem.
Then come the visuals: KPI cards, trend charts, tables, filters, drill-downs, exports. These are what users actually touch.
Finally, the host app ties everything together. Your front end decides where analytics live, how users navigate to them, how filters connect to the rest of the product, and how branded the experience feels. That host layer is often where embedded analytics projects either become elegant or start to creak.
Authentication, JWTs, SSO, and row-level security
Security is where technical evaluations get real. If your product serves multiple customers, embedded analytics has to know exactly who is asking for data and what slice of data belongs to that person.
JWTs, or JSON Web Tokens, are a common way to handle this. Your app signs a token that says, in effect, “this user is authenticated, belongs to this tenant, and has these permissions.” The analytics platform trusts that signed token and renders only what the user should see.
Single sign-on solves a different problem. SSO lets users move between systems without separate passwords or login prompts. Helpful, yes, but SSO alone is not enough. A smooth login does not guarantee correct data isolation.
That’s where row-level security comes in. RLS limits which rows of data a user can query or view. If a customer from Acme opens a dashboard, RLS should ensure Acme sees only Acme’s data, not data from Beta Corp two doors down in the same warehouse. This is the nightmare scenario to design against, because tenant leakage is the kind of mistake that gets remembered for all the wrong reasons.
iFrame, SDK, and API-based embedding
The fastest route is often an iFrame. You generate a secure embed URL, drop it into your app, and get a working dashboard on screen quickly. The tradeoff is control. iFrames can feel boxed in, and deep customization is often limited.
SDK-based embedding gives you more flexibility. You can control events, filters, theming, layout behavior, and interactions more cleanly. For a polished product experience, this is usually the better middle ground.
API-based embedding sits at the far end of control. Here, your app may use APIs to fetch metadata, trigger queries, or even render parts of the experience itself. That gives you freedom, but also more engineering work and more surface area to maintain.
Here’s the thing: implementation choice is not cosmetic. It affects how much control you have over branding, filters, navigation, upgrades, testing, and long-term maintainability.
Embedded Analytics vs. BI vs. Embedded BI
These terms blur together in vendor pages, which is why this part trips teams up.
Traditional BI is the broad category: tools for analyzing data, building dashboards, and answering business questions. Most internal analytics teams use BI for operators, analysts, finance, product, and leadership.
Embedded analytics is the user experience pattern of putting analytics into another product or portal. It focuses on where and how analytics are consumed.
Embedded BI usually means using a BI platform as the engine behind that embedded experience. In other words, BI is the underlying tool, and embedding is the delivery model.
So yes, the terms overlap. But they are not interchangeable. BI describes the analytics system. Embedded analytics describes the in-product experience. Embedded BI sits in the middle and usually refers to BI software delivered through an embedded layer.
When internal BI is enough
Sometimes you do not need embedding at all. If dashboards are only for your revenue ops team, product analysts, or executives, internal BI is enough. Users can log into Looker, Tableau, Power BI, or another tool directly and do their work there.
This setup is simpler because the audience is limited, identity is easier to manage, and white-labeling usually does not matter. You care about analysis quality and governance more than native product feel.
If no external user will ever touch the dashboard, embedding may just add work.
When customer-facing analytics changes the job
Once external users are involved, the job changes. Suddenly, you need branded navigation, tenant isolation, customer-level permissions, onboarding flows, support documentation, export controls, and performance that holds up when hundreds of customers load dashboards Monday morning at 8:30.
Customers also judge analytics as part of your product, not as a separate tool. Slow filter response, awkward login behavior, or vendor chrome peeking through the edges can make the whole feature feel unfinished. Expectations rise fast.
Why Teams Choose Embedded Analytics
Teams choose embedded analytics because asking customers to leave the product for reporting creates friction, and friction kills usage.
The business case is usually straightforward. Better in-app reporting keeps users in context, makes the product more useful, and reduces the burden on support or analytics teams who otherwise field recurring report requests. For agencies and consultancies, it also creates a cleaner client experience. One portal, one login, one place to check results.
Better product experience and stickier accounts
When analytics show up inside the workflow, users actually see them. A billing admin checks cost trends while reviewing invoices. A marketing user sees campaign results inside the same portal used to launch campaigns. A customer success lead spots account health before opening a support ticket list.
That kind of placement matters because it reduces context switching. It also makes your product feel more complete. Reporting stops being a side feature and becomes part of the value customers pay for.
And yes, this can make accounts stickier. If your product becomes the place where customers not only do the work but also understand the results, it gets harder to replace.
Faster delivery than building the full reporting layer yourself
Here’s a direct claim: building charts is the easy part. Building secure, multi-tenant, customer-facing analytics is the catch.
You are not just rendering bars and lines. You are handling auth flows, signed tokens, user provisioning, tenant permissions, exports, caching, theming, admin controls, lifecycle management, and the endless edge cases that show up after launch. A platform that already solves those layers can cut months off delivery.
That speed matters when analytics are on the roadmap now, not six quarters from now.
A path to monetization or premium reporting tiers
Embedded analytics also creates room for packaging. Maybe the base plan gets a dashboard and standard exports, while higher tiers get drill-downs, scheduled delivery, benchmarking, or advanced forecasting. Maybe an agency offers branded client portals as a premium service. Maybe a SaaS platform turns usage analytics into part of the expansion story.
The point is not to bolt on a pricing gimmick. The point is that reporting can become part of the product package instead of an internal cost center.
Common Types of Embedded Analytics You Can Offer
Not every embedded analytics experience needs to look like a full BI tool. In fact, many of the best ones don’t. The right shape depends on the job users need done.
Dashboards and KPI scorecards
This is the most common format for a reason. A dashboard or scorecard gives users a quick answer to “how are things going?” It might show product usage, MRR trends, support backlog, campaign performance, billing summaries, or customer health.
Done well, this page becomes a morning habit. Open portal, scan metrics, spot change, take action.
Self-service exploration and filtering
Sometimes users need more than a summary. Self-service exploration lets users filter by account, date range, region, plan type, campaign, or team without filing a ticket for every variation.
This is where embedded analytics starts to save your internal team real time. Instead of rebuilding reports every week, you give users safe ways to answer the next layer of questions on their own.
Scheduled reports, alerts, and exports
Operational analytics often needs delivery, not just display. Users want a Monday morning email, a CSV for finance, a PDF for a board packet, or an alert when usage drops below a threshold.
These features sound small, but they matter because analytics is often part of a workflow outside the dashboard itself. If the only way to get data out is to stare at a chart on screen, the experience stops short.
Advanced analytics and AI-assisted insights
Advanced analytics can include anomaly detection, forecasting, natural language querying, or generated summaries of what changed. Useful in the right context. Hype-filled in the wrong one.
The trick is to keep this grounded. If AI can explain why ticket volume spiked 18 percent this week or summarize the biggest account changes before a renewal call, that helps. If it adds vague commentary nobody trusts, it becomes decorative software.
The Features That Matter Most in an Embedded Analytics Platform
Feature lists get noisy fast. The better way to evaluate a platform is to focus on what actually affects delivery, security, and user experience.
White-labeling and UI customization
Your analytics should feel native. That means matching fonts, colors, spacing, navigation patterns, and hiding vendor chrome where possible. It also means controlling which controls users see, how filters behave, and how dashboards fit into your product layout.
If the analytics page feels like a borrowed room with someone else’s furniture, users notice.
Multi-tenant security and governance
For customer-facing use cases, this is non-negotiable. You need tenant isolation, permission controls, auditability, and support for compliance expectations your customers will absolutely ask about once reporting goes live.
Governance also matters internally. Who can edit a dashboard? Who can publish changes? How are access rules reviewed? How do you trace who saw what and when? These questions are boring right up until they are urgent.
Performance, scale, and caching
Performance is product experience. If dashboards take 12 seconds to load, users stop trusting the feature. If one large tenant can generate expensive warehouse queries all morning, your costs rise with every click.
Look closely at caching, pre-aggregation, concurrency handling, and how the platform behaves under real load. Monday morning traffic is a good mental model. If 300 customers open the same dashboard before 10 a.m., what happens?
Developer experience and lifecycle management
A slick demo is not enough. Your team has to build, test, promote, version, and maintain this setup over time.
Good developer experience means workable SDKs, sane APIs, environment promotion, embed management, and a setup that does not turn brittle after the first customization. The less manual dashboard babysitting required, the better.
Build vs. Buy: The Decision Most Teams Get Stuck On
If your team can build software, the temptation is obvious: why not build the embedding layer yourself and keep full control?
Because the visible part of the problem is only part of the problem.
What “build it yourself” really includes
Building it yourself includes authentication flows, signed embed tokens, SSO mapping, user provisioning, row-level security, dashboard rendering, filtering controls, export jobs, audit logs, theme management, error handling, admin tools, and support workflows when something breaks for one tenant but not another.
That is before you get to performance tuning, caching, version control for dashboards, testing impersonated users, and handling upgrades cleanly. The chart is one slice of the effort. Often not even the biggest slice.
When buying makes sense
Buying usually makes sense when analytics is important but not the only thing your platform team needs to ship this year. It also makes sense when deadlines are aggressive, tenancy is complex, or your team needs customer-facing analytics across many accounts fast.
Agencies and consultancies often land here too. If your business depends on spinning up branded reporting portals for multiple clients, speed and repeatability matter more than reinventing the plumbing each time.
When building can still be the right call
Building can still be the right move if your user experience is highly custom, your deployment requirements are unusually strict, or your existing analytics stack already solves most of the security and rendering problem.
It can also make sense if analytics is a core product surface, not a supporting feature, and deep ownership is worth the cost. Just be honest about the cost. Underestimating it is the classic mistake.
How to Implement Embedded Analytics Without Making a Mess
The cleanest implementations start with scope discipline. Not a giant dashboard gallery. Not twelve personas. One solid use case tied to a real workflow.
Start with the user job, not the dashboard gallery
Begin with the question users need answered inside the product. Are customers checking adoption before renewal? Monitoring campaign results after launch? Tracking spend against budget inside a billing portal?
If you start by collecting random charts, you end up with decorative reporting. If you start with the user job, the dashboard earns its place.
Choose the embedding method and security model early
Pick your embedding approach and security design early because these decisions shape almost everything else. SDK versus iFrame affects flexibility. JWT signing affects how identity is passed. SSO affects onboarding and support. Tenant permissions affect data modeling and testing.
Changing these choices late is painful.
Plan data modeling before front-end polish
Pretty dashboards with broken numbers are worse than no dashboards. Users forgive plain visuals for a while. They do not forgive inconsistent metrics.
Define your semantic layer early. Lock down how core metrics are calculated. Make sure the same business concept means the same thing across dashboards, exports, and alerts. Trust is the product here.
Roll out in phases
A phased launch is usually the smart move: start with one core dashboard, add filters and drill-downs next, then exports and scheduled delivery, then broader self-service where it makes sense.
This keeps scope under control and gives your team a chance to validate security, adoption, and performance before expanding.
Challenges You’ll Run Into and How to Handle Them
Embedded analytics projects nearly always uncover a few ugly truths. That is normal. The trick is spotting them early enough to fix the right layer.
Messy source data and conflicting metric definitions
Analytics projects expose upstream data problems because dashboards make disagreements visible. Suddenly, finance has one revenue number, product has another, and customer success is using a third definition in renewal calls.
Fix ownership and definitions before adding more dashboards. Otherwise, you scale confusion.
Permission bugs and tenant leakage risk
This is the risk that keeps engineering leaders up at night for good reason. If the wrong customer sees the wrong data, trust can disappear in one screenshot.
Test row-level security aggressively. Use impersonation testing, audit logs, and tenant-specific validation before launch. Do not treat permissions as a final QA pass. Treat them as part of the architecture.
Slow dashboards and expensive queries
Slow dashboards usually come from heavy joins, wide date ranges, poor warehouse tuning, missing aggregates, or too many live queries hitting the same underlying model.
Caching and pre-aggregation solve a lot. So does being honest about what needs to be real time and what can refresh every hour without anyone caring.
Adoption problems even after launch
Shipping dashboards does not guarantee anyone uses them. If analytics is tucked away in a settings menu, adoption will lag. If defaults are confusing, users bounce. If every dashboard starts empty until filters are set, users feel lost.
Put analytics where work already happens. Set sensible default filters. Highlight metrics tied to action, not vanity.
Real-World Use Cases for B2B SaaS, Agencies, and Internal Portals
The category gets easier to evaluate once you see your own setup in it.
SaaS customer portals
In B2B SaaS, embedded analytics often shows up as usage dashboards, billing views, account health summaries, campaign performance pages, or operational reporting inside a customer-facing app. Customers want answers without another login or another tool to learn.
That is the pattern: reporting in context, close to the workflow it supports.
Agency and consultancy reporting hubs
For agencies and consultancies, the value is often white-labeled client reporting that pulls in data from ads platforms, CRM systems, web analytics, and back-office sources into one branded portal.
Instead of juggling separate BI logins for every client, you give each customer one place to check results. Cleaner for your team, cleaner for the client.
Internal portals across multiple BI tools
Some internal platform teams use embedded analytics to build one front door across several BI vendors. Maybe finance lives in one system, product analytics in another, and operations in a third. A shared portal can unify access, identity, and branding even if the dashboards themselves come from different tools.
That use case is less about customer-facing monetization and more about reducing sprawl.
How to Evaluate an Embedded Analytics Solution
A good evaluation looks past demo polish and gets into implementation reality fast.
Questions to ask vendors before a demo
Ask about time to first secure embed, supported embedding methods, JWT and SSO options, row-level security design, white-label depth, export support, API coverage, deployment model, and what pricing does when customer usage grows.
Those answers tell you more than another glossy sample dashboard.
Red flags to notice in pricing and architecture
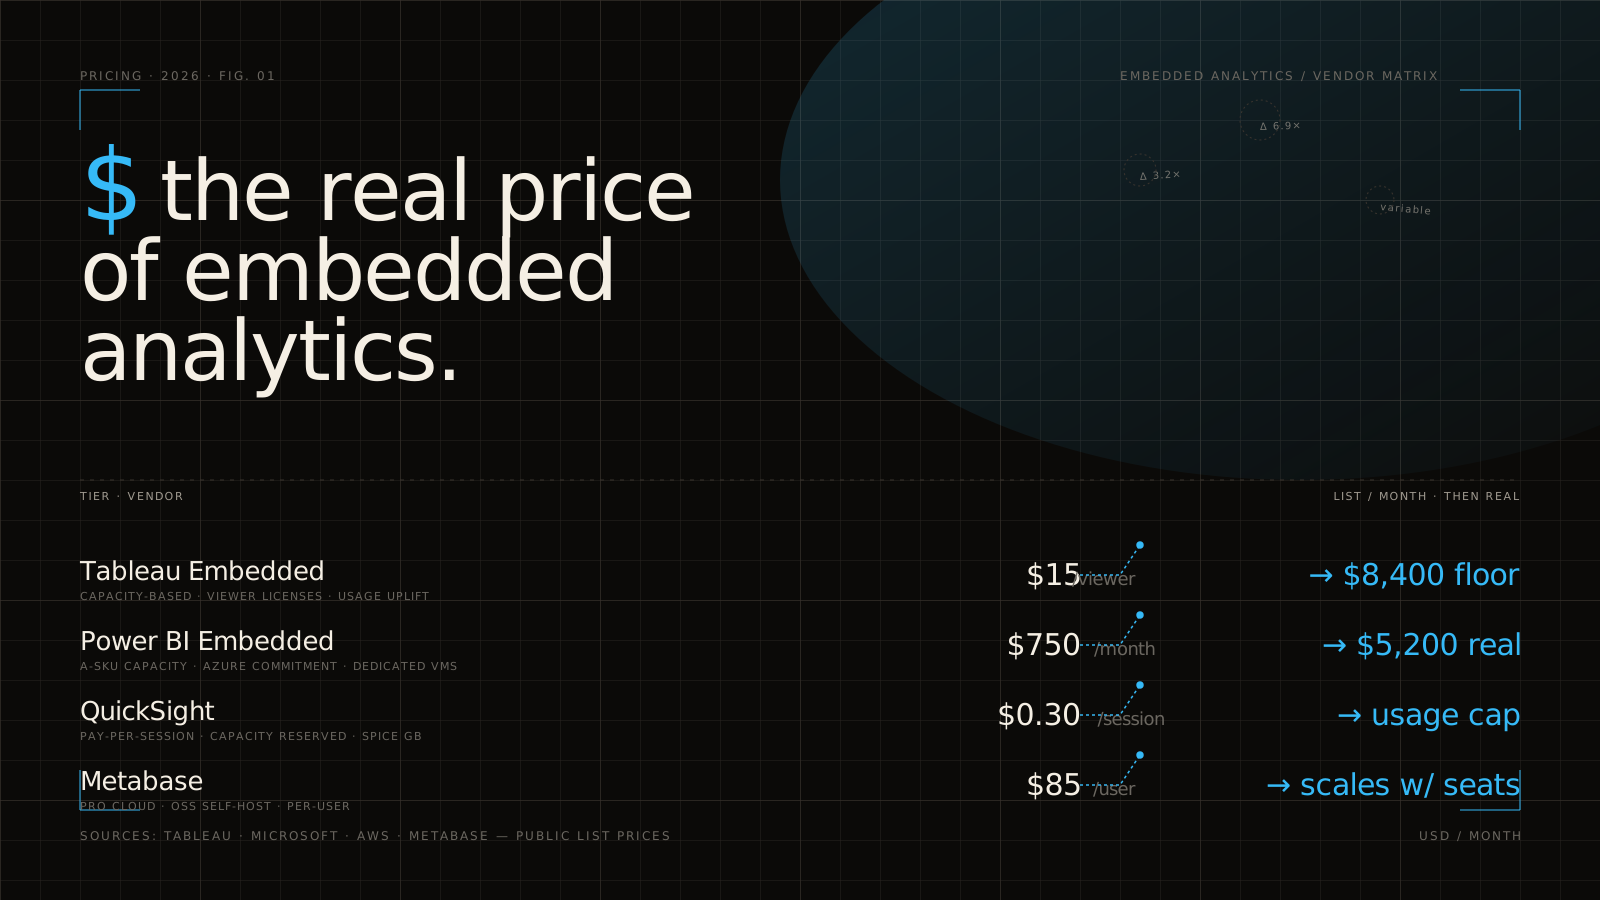
Be careful with seat-based pricing for customer-facing analytics. It can get ugly fast if every end user needs a paid seat. Watch for shallow theming, weak RLS, limited tenant controls, or architectures that depend on lots of manual dashboard duplication and maintenance.
If the setup only looks good in a small demo tenant, that is a warning sign.
Proof points to validate in a trial
During a trial, get one secure embed working end to end. Test JWT signing. Pass filters from your app. Push branding as far as your product team will want it. Check load times with realistic data volumes. Try user provisioning and tenant switching.
The goal is not to admire features. The goal is to find where the seams show.
What to understand before you go deeper
Once you understand embedded data analytics, the decision gets simpler: you are not choosing between “charts” and “no charts.” You are choosing how much of the embedding, security, tenancy, and product experience your team wants to own.
The best first move is narrow and real. Pick one customer-facing workflow, one dashboard that clearly belongs inside it, and get the security path right before expanding. That small test tells you more than ten vendor pages ever will.